
Compare Espire Hospi with Similar Stocks
Dashboard
Poor Management Efficiency with a low ROCE of 4.26%
- The company has been able to generate a Return on Capital Employed (avg) of 4.26% signifying low profitability per unit of total capital (equity and debt)
High Debt Company with a Debt to Equity ratio (avg) of 8.60 times
Flat results in Mar 26
With ROCE of 8.9, it has a Expensive valuation with a 2.4 Enterprise value to Capital Employed
Underperformed the market in the last 1 year
Stock DNA
Hotels & Resorts
INR 313 Cr (Micro Cap)
33.00
26
0.00%
3.18
21.44%
8.00
Total Returns (Price + Dividend) 
Espire Hospi for the last several years.
Risk Adjusted Returns v/s
Returns Beta

News
Are Espire Hospitality Ltd latest results good or bad?
Espire Hospitality Ltd's latest financial results for Q4 FY26 present a mixed picture. The company achieved its highest-ever quarterly revenue of ₹42.67 crores, reflecting a sequential growth of 4.15% compared to the previous quarter. However, this revenue growth is overshadowed by a significant decline in profitability metrics. The net profit for the quarter was reported at ₹4.22 crores, which represents a sharp decline of 48.48% from the prior quarter. The operating margin also saw a substantial contraction, falling to 11.48% from 35.73% in the previous quarter, indicating a notable deterioration in operational efficiency. This decline in margins is attributed to rising operational costs, including a 63.49% increase in interest expenses and a significant rise in depreciation costs. The company's reliance on non-operating income further complicates the financial narrative, as this income constituted a la...
Read full news article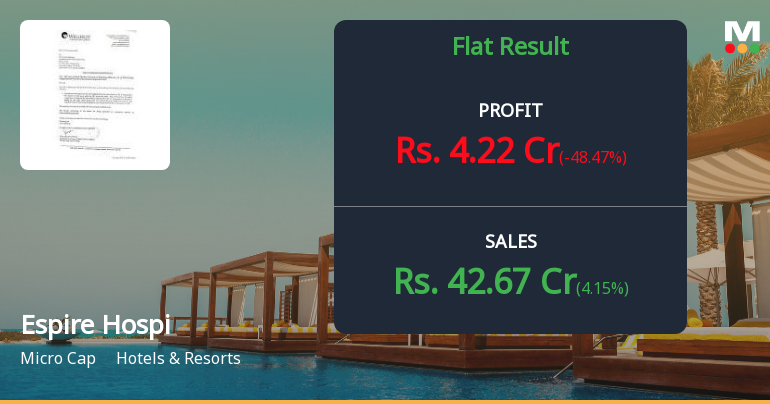
Espire Hospitality Q4 FY26: Sharp Profit Decline Amid Revenue Growth Masks Deeper Concerns
Espire Hospitality Limited, a micro-cap hotel operator with a market capitalisation of ₹313.00 crores, reported its March 2026 quarter (Q4 FY26) results that revealed a troubling divergence between top-line growth and bottom-line performance. The company's net profit stood at ₹4.22 crores, representing a decline of 48.48% quarter-on-quarter from ₹8.19 crores in Q3 FY26, though showing improvement of 6.01% year-on-year from ₹4.49 crores in Q4 FY25. This mixed performance triggered a sharp market reaction, with shares plunging 13.02% to ₹179.10, reflecting investor concerns about operational efficiency and profitability sustainability despite modest revenue expansion.
Read full news article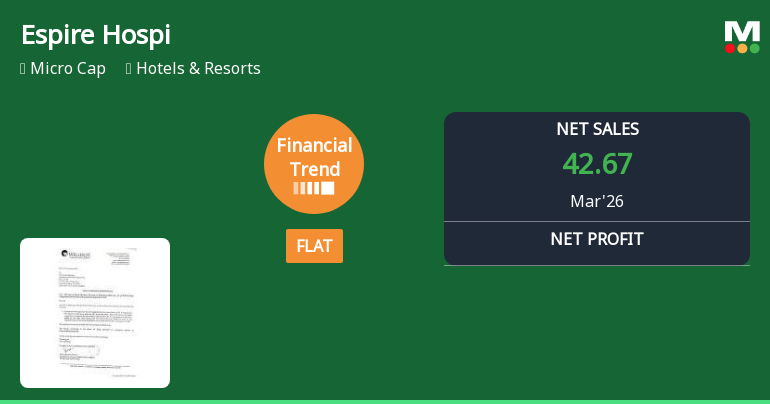
Espire Hospitality Ltd Reports Flat Quarterly Performance Amid Margin Pressures
Espire Hospitality Ltd, a micro-cap player in the Hotels & Resorts sector, has reported a flat financial performance for the quarter ended March 2026, signalling a notable shift from its previously positive growth trajectory. Despite achieving record net sales and a doubling of quarterly PAT, the company’s profitability metrics have been weighed down by rising interest costs and a significant contraction in operating profit before interest.
Read full news article Announcements
Board Meeting Intimation for Notice Of Board Meeting To Be Held On 10Th June2026
04-Jun-2026 | Source : BSEEspire Hospitality Limitedhas informed BSE that the meeting of the Board of Directors of the Company is scheduled on 10/06/2026 inter alia to consider and approve As per intimation attached
Delay In Audited Results For Q4 And Year Ended 31St March2026
26-May-2026 | Source : BSEAs per intimation attached
Announcement under Regulation 30 (LODR)-Press Release / Media Release
06-May-2026 | Source : BSEAS PER INTIMATION ATTACHED
Corporate Actions

No Upcoming Board Meetings

No Dividend history available

No Splits history available

No Bonus history available

No Rights history available
Quality key factors
Valuation key factors
Technicals key factors
 Technical Indicator Scale: Bearish, Mildly Bearish, Sideways, Mildly Bullish, Bullish Turned
 Shareholding Snapshot : Mar 2026
Shareholding Compare (%holding)
Promoters
None
Held by 0 Schemes
Held by 1 FIIs (2.08%)
Mr. Amit Rai (69.25%)
Mr Rajesh Kumar Gupta (6.96%)
17.54%
Quarterly Results Snapshot (Standalone) - Mar'26 - QoQ

QoQ Growth in quarter ended Mar 2026 is 4.15% vs 116.77% in Dec 2025
QoQ Growth in quarter ended Mar 2026 is -48.47% vs 243.43% in Dec 2025
Half Yearly Results Snapshot (Standalone) - Sep'25
Growth in half year ended Sep 2025 is 37.04% vs 156.46% in Sep 2024
Growth in half year ended Sep 2025 is -533.33% vs 10.00% in Sep 2024
Nine Monthly Results Snapshot (Standalone) - Dec'25
YoY Growth in nine months ended Dec 2025 is 17.23% vs 202.09% in Dec 2024
YoY Growth in nine months ended Dec 2025 is 3.17% vs 111.17% in Dec 2024
Annual Results Snapshot (Standalone) - Mar'26
YoY Growth in year ended Mar 2026 is 12.30% vs 234.31% in Mar 2025
YoY Growth in year ended Mar 2026 is -1.81% vs 223.05% in Mar 2025
About Espire Hospitality Ltd

Company Coordinates


