
Compare Eternal with Similar Stocks
Stock DNA
E-Retail/ E-Commerce
INR 246,566 Cr (Large Cap)
673.00
20
0.00%
-0.07
1.18%
7.98
Total Returns (Price + Dividend) 
Eternal for the last several years.
Risk Adjusted Returns v/s
Returns Beta

News

Eternal Ltd Sees Sharp Surge in Derivatives Open Interest Amid Mixed Market Signals
Eternal Ltd, a large-cap player in the E-Retail and E-Commerce sector, has witnessed a significant 24.4% surge in open interest (OI) in its derivatives segment, signalling heightened market activity and shifting investor positioning. Despite a modest 0.18% day change in the stock price, the spike in OI alongside rising volumes suggests evolving directional bets and increased speculative interest ahead of potential market catalysts.
Read full news article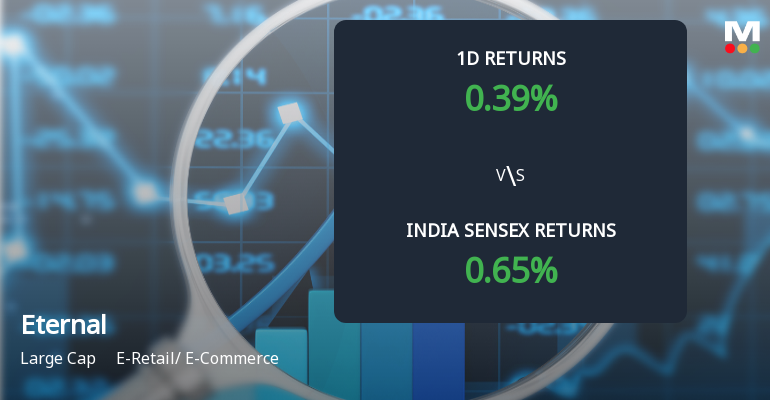
Eternal Ltd Sees Sharp Open Interest Surge Amid Mixed Market Signals
Eternal Ltd, a large-cap player in the E-Retail and E-Commerce sector, has witnessed a significant 19.2% surge in open interest in its derivatives segment, signalling heightened market activity and shifting investor positioning. Despite a modest 0.29% price gain today, the stock’s mixed technical indicators and evolving volume patterns suggest a complex interplay of bullish and bearish bets among traders.
Read full news article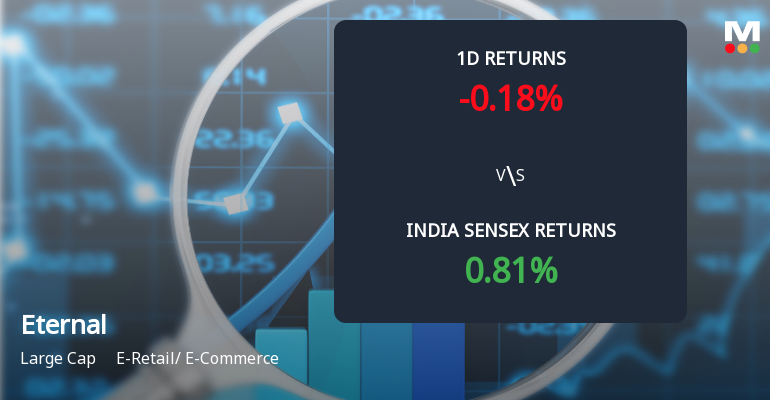
Eternal Ltd Sees Sharp Open Interest Surge Amid Mixed Market Signals
Eternal Ltd, a large-cap player in the E-Retail and E-Commerce sector, has witnessed a notable 14.0% surge in open interest in its derivatives segment, signalling heightened market activity and shifting investor positioning. Despite this spike, the stock has underperformed its sector and broader indices, reflecting a complex interplay between rising investor interest and cautious price action.
Read full news article Announcements
Closure of Trading Window
19-Jun-2026 | Source : BSEEternal Limited has informed the Exchange regarding the Trading Window Closure pursuant to SEBI (Prohibition of Insider Trading) Regulations 2015.
General Updates
10-Jun-2026 | Source : BSEEternal Limited has informed the exchange regarding order received from Deputy Commissioner (ST) State Special Circle-I Andhra Pradesh.
Announcement under Regulation 30 (LODR)-Earnings Call Transcript
06-May-2026 | Source : BSEEternal Limited has filed with exchange transcript of earnings conference call conducted on April 28 2026.
Corporate Actions

No Upcoming Board Meetings

No Dividend history available

No Splits history available

No Bonus history available

No Rights history available
Quality key factors
Valuation key factors
Technicals key factors
 Technical Indicator Scale: Bearish, Mildly Bearish, Sideways, Mildly Bullish, Bullish Turned
 Shareholding Snapshot : Mar 2026
Shareholding Compare (%holding)
FIIs
None
Held by 45 Schemes (28.91%)
Held by 1353 FIIs (32.61%)
None
Info Edge (india) Limited (12.38%)
7.62%
Quarterly Results Snapshot (Consolidated) - Mar'26 - QoQ

QoQ Growth in quarter ended Mar 2026 is 5.99% vs 20.05% in Dec 2025

QoQ Growth in quarter ended Mar 2026 is 70.59% vs 56.92% in Dec 2025
Half Yearly Results Snapshot (Consolidated) - Sep'25
Growth in half year ended Sep 2025 is 130.51% vs 71.07% in Sep 2024
Growth in half year ended Sep 2025 is -79.02% vs 1,028.95% in Sep 2024
Nine Monthly Results Snapshot (Consolidated) - Dec'25
YoY Growth in nine months ended Dec 2025 is 157.27% vs 68.50% in Dec 2024
YoY Growth in nine months ended Dec 2025 is -60.66% vs 177.27% in Dec 2024
Annual Results Snapshot (Consolidated) - Mar'26
YoY Growth in year ended Mar 2026 is 168.56% vs 67.10% in Mar 2025
YoY Growth in year ended Mar 2026 is -30.55% vs 50.14% in Mar 2025
About Eternal Ltd

Company Coordinates


