
Compare Euro India Fresh with Similar Stocks
Dashboard
Weak Long Term Fundamental Strength with an average Return on Capital Employed (ROCE) of 6.77%
- Poor long term growth as Net Sales has grown by an annual rate of 6.90% over the last 5 years
- Low ability to service debt as the company has a high Debt to EBITDA ratio of 3.90 times
The company has declared positive results in Mar'2026 after 2 consecutive negative quarters
With ROCE of 8.7, it has a Very Expensive valuation with a 6.5 Enterprise value to Capital Employed
Increasing Participation by Institutional Investors
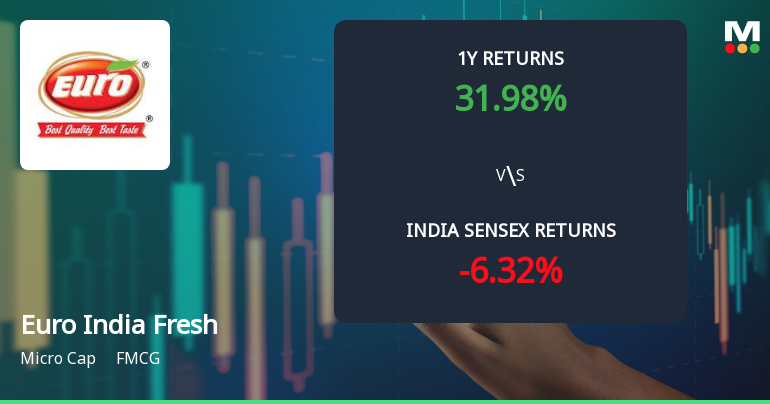
Total Returns (Price + Dividend) 
Euro India Fresh for the last several years.
Risk Adjusted Returns v/s
Returns Beta

News
Euro India Fresh Foods Ltd Technical Momentum Shifts to Bullish Amid Strong Returns
Euro India Fresh Foods Ltd has witnessed a notable shift in its technical momentum, moving from a mildly bullish stance to a more confident bullish trend. This change is underscored by a confluence of positive signals across key technical indicators including MACD, moving averages, and Bollinger Bands, suggesting renewed investor interest and potential upside in the micro-cap FMCG stock.
Read full news article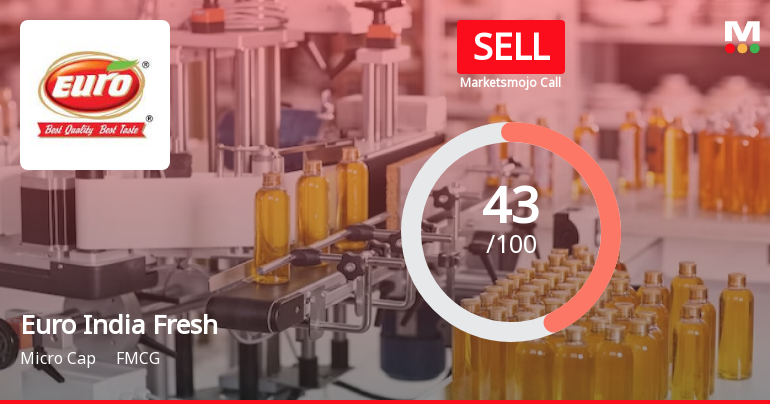
Euro India Fresh Foods Ltd is Rated Sell
Euro India Fresh Foods Ltd is rated 'Sell' by MarketsMOJO, with this rating last updated on 06 July 2026. However, the analysis and financial metrics discussed here reflect the stock's current position as of 12 July 2026, providing investors with the latest insights into the company’s performance and outlook.
Read full news article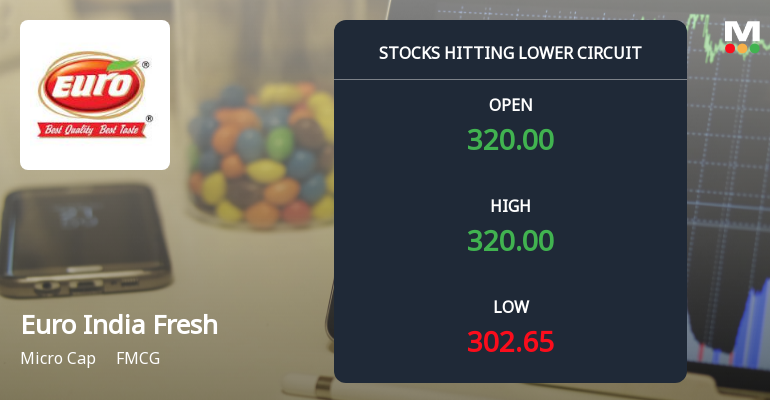
Euro India Fresh Foods Ltd Locks at Lower Circuit With 2.06% Loss — Sellers Queue, No Buyers in Sight
At Rs 312.00, sellers were still queuing — but there were no buyers willing to take the other side. Euro India Fresh Foods Ltd locked at its lower circuit of 2.06% on 08 Jul 2026, with unfilled sell orders and a frozen price.
Read full news article Announcements
Euro India Fresh Foods Limited - Reply to Clarification- Financial results
09-Dec-2019 | Source : NSEEuro India Fresh Foods Limiteddia Fresh Foods Limited for the quarter ended 30-Sep-2019 with respect to Regulation 33 of the SEBI (Listing Obligations and Disclosure Requirements) Regulations, 2015.
Euro India Fresh Foods Limited - Clarification - Financial Results
03-Dec-2019 | Source : NSEEuro India Fresh Foods Limitedh Foods Limited for the quarter ended 30-Sep-2019 with respect to Regulation 33 of the SEBI (Listing Obligations and Disclosure Requirements) Regulations, 2015.
Euro India Fresh Foods Limited - Outcome of Board Meeting
14-Nov-2019 | Source : NSEEuro India Fresh Foods Limited has informed the Exchange regarding Board meeting held on November 13, 2019.
Corporate Actions

No Upcoming Board Meetings

No Dividend history available

No Splits history available

No Bonus history available

No Rights history available
Quality key factors
Valuation key factors
Technicals key factors
 Technical Indicator Scale: Bearish, Mildly Bearish, Sideways, Mildly Bullish, Bullish Turned
 Shareholding Snapshot : Mar 2026
Shareholding Compare (%holding)
Promoters
None
Held by 0 Schemes
Held by 1 FIIs (0.05%)
Manhar Jivanbhai Sanspara (34.12%)
Money Logix Securities Private Limited (2.98%)
13.35%
Quarterly Results Snapshot (Standalone) - Mar'26 - YoY

YoY Growth in quarter ended Mar 2026 is 71.58% vs 32.70% in Mar 2025

YoY Growth in quarter ended Mar 2026 is 80.23% vs 1,820.00% in Mar 2025
Half Yearly Results Snapshot (Standalone) - Sep'25
Growth in half year ended Sep 2025 is 4.38% vs 11.32% in Sep 2024
Growth in half year ended Sep 2025 is -129.41% vs 21.43% in Sep 2024
Nine Monthly Results Snapshot (Standalone) - Dec'25
YoY Growth in nine months ended Dec 2025 is -15.38% vs 28.12% in Dec 2024
YoY Growth in nine months ended Dec 2025 is -86.28% vs 40.17% in Dec 2024
Annual Results Snapshot (Standalone) - Mar'26
YoY Growth in year ended Mar 2026 is 5.77% vs 29.22% in Mar 2025
YoY Growth in year ended Mar 2026 is -11.25% vs 155.71% in Mar 2025
About Euro India Fresh Foods Ltd

Company Coordinates


