
Compare Euro India Fresh with Similar Stocks
Dashboard
Weak Long Term Fundamental Strength with an average Return on Capital Employed (ROCE) of 6.77%
- Poor long term growth as Net Sales has grown by an annual rate of 6.90% over the last 5 years
- Low ability to service debt as the company has a high Debt to EBITDA ratio of 3.90 times
With ROCE of 8.7, it has a Expensive valuation with a 4.7 Enterprise value to Capital Employed
Below par performance in long term as well as near term
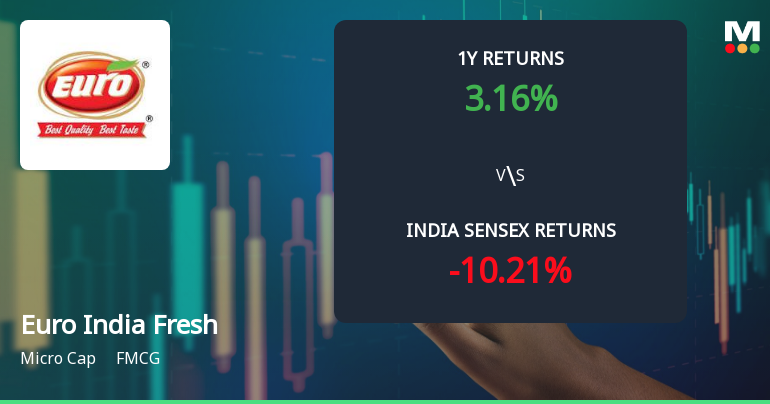
Total Returns (Price + Dividend) 
Euro India Fresh for the last several years.
Risk Adjusted Returns v/s
Returns Beta

News
Euro India Fresh Foods Ltd Technical Momentum Shifts Amid Mixed Indicators
Euro India Fresh Foods Ltd, a micro-cap player in the FMCG sector, has exhibited a notable shift in its technical momentum, transitioning from a bearish trend to a sideways movement. Despite a modest day decline of 0.21%, the stock’s technical indicators present a complex picture, with some signals suggesting mild bullishness while others remain bearish, reflecting a cautious outlook for investors.
Read full news article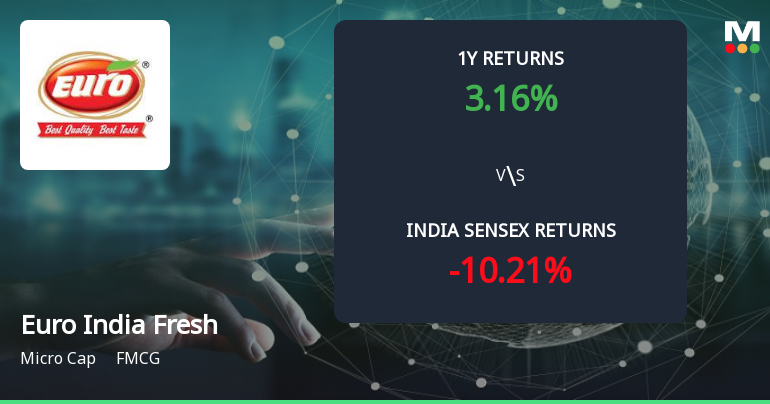
Golden Cross Forms in Euro India Fresh Foods Ltd — On a Day the Stock Fell 0.21%. What the Mixed Signals Mean
The 50-day moving average has crossed above the 200-day moving average for Euro India Fresh Foods Ltd, signalling a golden cross on 10 Jun 2026. Yet, the stock declined 0.21% on the day the cross formed, while monthly momentum indicators remain bearish. This juxtaposition of signals calls for a detailed examination of the technical and fundamental context to assess the signal’s reliability.
Read full news article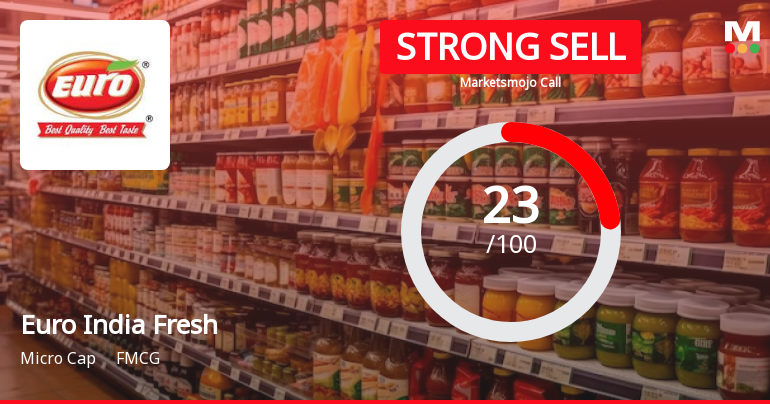
Euro India Fresh Foods Ltd is Rated Strong Sell
Euro India Fresh Foods Ltd is rated Strong Sell by MarketsMOJO. This rating was last updated on 01 February 2026, reflecting a reassessment of the stock’s outlook. However, all fundamentals, returns, and financial metrics discussed here are current as of 09 June 2026, providing investors with the latest perspective on the company’s position.
Read full news article Announcements
Euro India Fresh Foods Limited - Reply to Clarification- Financial results
09-Dec-2019 | Source : NSEEuro India Fresh Foods Limiteddia Fresh Foods Limited for the quarter ended 30-Sep-2019 with respect to Regulation 33 of the SEBI (Listing Obligations and Disclosure Requirements) Regulations, 2015.
Euro India Fresh Foods Limited - Clarification - Financial Results
03-Dec-2019 | Source : NSEEuro India Fresh Foods Limitedh Foods Limited for the quarter ended 30-Sep-2019 with respect to Regulation 33 of the SEBI (Listing Obligations and Disclosure Requirements) Regulations, 2015.
Euro India Fresh Foods Limited - Outcome of Board Meeting
14-Nov-2019 | Source : NSEEuro India Fresh Foods Limited has informed the Exchange regarding Board meeting held on November 13, 2019.
Corporate Actions

No Upcoming Board Meetings

No Dividend history available

No Splits history available

No Bonus history available

No Rights history available
Quality key factors
Valuation key factors
Technicals key factors
 Technical Indicator Scale: Bearish, Mildly Bearish, Sideways, Mildly Bullish, Bullish Turned
 Shareholding Snapshot : Mar 2026
Shareholding Compare (%holding)
Promoters
None
Held by 0 Schemes
Held by 1 FIIs (0.05%)
Manhar Jivanbhai Sanspara (34.12%)
Money Logix Securities Private Limited (2.98%)
13.35%
Quarterly Results Snapshot (Standalone) - Mar'26 - YoY

YoY Growth in quarter ended Mar 2026 is 71.58% vs 32.70% in Mar 2025

YoY Growth in quarter ended Mar 2026 is 80.23% vs 1,820.00% in Mar 2025
Half Yearly Results Snapshot (Standalone) - Sep'25
Growth in half year ended Sep 2025 is 4.38% vs 11.32% in Sep 2024
Growth in half year ended Sep 2025 is -129.41% vs 21.43% in Sep 2024
Nine Monthly Results Snapshot (Standalone) - Dec'25
YoY Growth in nine months ended Dec 2025 is -15.38% vs 28.12% in Dec 2024
YoY Growth in nine months ended Dec 2025 is -86.28% vs 40.17% in Dec 2024
Annual Results Snapshot (Standalone) - Mar'26
YoY Growth in year ended Mar 2026 is 5.77% vs 29.22% in Mar 2025
YoY Growth in year ended Mar 2026 is -11.25% vs 155.71% in Mar 2025
About Euro India Fresh Foods Ltd

Company Coordinates


