
Compare EverCommerce, Inc. with Similar Stocks
Dashboard
Poor Management Efficiency with a low ROCE of 2.46%
- The company has been able to generate a Return on Capital Employed (avg) of 2.46% signifying low profitability per unit of total capital (equity and debt)
Company has a low Debt to Equity ratio (avg) at times
Healthy long term growth as Net Sales has grown by an annual rate of 17.07%
Positive results in Jun 25
With ROE of 4.93%, it has a risky valuation with a 2.53 Price to Book Value
Total Returns (Price + Dividend) 
EverCommerce, Inc. for the last several years.
Risk Adjusted Returns v/s
News
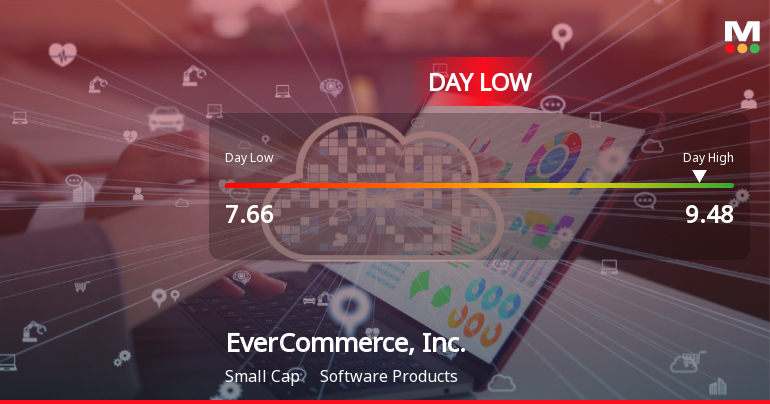
EverCommerce Stock Hits Day Low of $7.66 Amid Price Pressure
EverCommerce, Inc. has faced notable volatility, with its stock declining significantly on November 7, 2025. Over the past week and year, the company has underperformed compared to the S&P 500. Despite a solid long-term growth rate in net sales, profitability challenges persist, reflected in its low return on capital employed.
Read full news article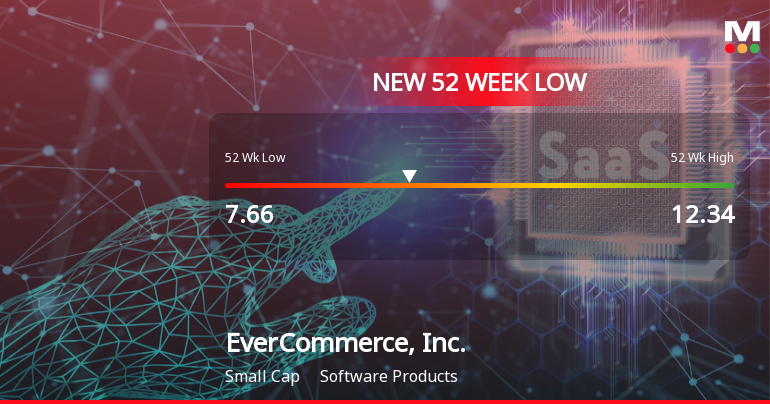
EverCommerce, Inc. Hits New 52-Week Low at $7.66
EverCommerce, Inc. has reached a new 52-week low, reflecting a significant decline in its stock price over the past year compared to the S&P 500. The company has a market capitalization of USD 2,121 million and a P/E ratio of 51.00, with notable sales growth but challenges in management efficiency.
Read full news article Announcements

Corporate Actions
Quality key factors
Valuation key factors
Technicals key factors
 Technical Indicator Scale: Bearish, Mildly Bearish, Sideways, Mildly Bullish, Bullish Turned
 Shareholding Snapshot : Sep 2025
Shareholding Compare (%holding)
Strategic Entities
Held in 23 Schemes (2.07%)
Held by 30 Foreign Institutions (0.67%)
Quarterly Results Snapshot (Consolidated) - Jun'25 - QoQ

QoQ Growth in quarter ended Jun 2025 is 4.01% vs -18.69% in Mar 2025
QoQ Growth in quarter ended Jun 2025 is 544.44% vs 107.38% in Mar 2025
Annual Results Snapshot (Consolidated) - Dec'24

YoY Growth in year ended Dec 2024 is 3.46% vs 8.81% in Dec 2023
YoY Growth in year ended Dec 2024 is 9.87% vs 23.75% in Dec 2023
About EverCommerce, Inc.

Company Coordinates


