Eveready Inds.

INR
286.20
3.85 (1.36%)
BSENSE

Mar 25

BSE+NSE Vol: 4.41 lacs

  • Price Points
  • Score
  • Mojo Parameters
  • Total Return
  • News and Corporate Actions
  • Key factors
  • Shareholding
  • Financials
  • CompanyCV
stock-summaryPrice Point
High/Low

1Day

52 Week

Valuation
Technical
Day's Volume

CASH

4.41 lacs (126.26%) Volume

Shareholding (Dec 2025)

FII

5.05%

Held by 37 FIIs

DII

0.10%

Held by 3 DIIs

Promoter

43.20%

Who are the top shareholders of the Eveready Inds.?

06-Jun-2025

The top shareholders of Eveready Industries include M B Finmart Private Limited with 11.81%, four mutual fund schemes holding 2.49%, and 35 foreign institutional investors with 4.86%. Theleme India Master Fund Limited is the largest public shareholder at 4.26%, while individual investors collectively own 22.34%.

The top shareholders of Eveready Industries include M B Finmart Private Limited, which holds the highest promoter stake at 11.81%. In addition to this, the company has 4 mutual fund schemes collectively holding 2.49%, and 35 foreign institutional investors (FIIs) with a combined holding of 4.86%. Theleme India Master Fund Limited is noted as the highest public shareholder, owning 4.26%. Individual investors also represent a significant portion of the shareholding, with a total of 22.34%.

View full answer

When is the next results date for Eveready Inds.?

06-Jun-2025

No Upcoming Board Meetings

What does Eveready Inds. do?

06-Jun-2025

Eveready Industries India Ltd is a small-cap FMCG company, primarily known for its battery and lighting products. As of March 2025, it reported net sales of ₹299 Cr and a net profit of ₹10 Cr, with a market cap of ₹2,311 Cr.

Overview: <BR>Eveready Industries India Ltd operates in the FMCG sector and is classified as a small-cap company.<BR><BR>History: <BR>The company was incorporated on June 24, 1934, and was formerly a subsidiary of Union Carbide Corporation, US. It was later taken over by B M Khaitan and the Williamson Magor Group of Companies. The latest quarterly results reported net sales and profit for March 2025.<BR><BR>Financial Snapshot: <BR>Net Sales: 299 Cr (Quarterly Results - Mar 2025) <BR>Net Profit: 10 Cr (Quarterly Results - Mar 2025) <BR>Market Cap: Rs 2,311 Cr (Small Cap) <BR><BR>Key Metrics: <BR>P/E: 28.00 <BR>Industry P/E: 33 <BR>Dividend Yield: 0.31% <BR>Debt Equity: 0.68 <BR>Return on Equity: 18.00% <BR>Price to Book: 5.07 <BR><BR>Contact Details: <BR>Address: 2 Rainey Park, Kolkata, West Bengal: 700019 <BR>Tel: 91-33-24559213/24864961 <BR>Email: investorrelation@eveready.co.in <BR>Website: http://www.evereadyindia.com

View full answer

Has Eveready Inds. declared dividend?

06-Jun-2025

Yes, Eveready Industries India Ltd has declared a 20% dividend, amounting to ₹1 per share, with an ex-date of July 26, 2024. While the company has shown significant gains over the past 5 years, recent total returns have been negative in shorter periods.

Eveready Industries India Ltd has declared a 20% dividend.<BR><BR>Dividend Details:<BR>- Percentage announced: 20%<BR>- Amount per share: 1 per share<BR>- Ex-date: 26 Jul 24<BR><BR>Dividend Yield: 0.31%.<BR><BR>Total Returns by Period:<BR>In the last 6 months, the price return was -16.85%, with a dividend return of 0%, resulting in a total return of -16.85%.<BR><BR>Over the past year, the price return was -3.31%, the dividend return was 0.29%, leading to a total return of -3.02%.<BR><BR>In the last 2 years, the price return was -5.13%, with a dividend return of 0.30%, culminating in a total return of -4.83%.<BR><BR>For the 3-year period, the price return was 0.98%, the dividend return was 0.34%, resulting in a total return of 1.32%.<BR><BR>In the last 4 years, the price return was -4.84%, with a dividend return of 0.32%, leading to a total return of -4.52%.<BR><BR>Over the past 5 years, the price return was 309.83%, the dividend return was 1.15%, resulting in a total return of 310.98%.<BR><BR>Overall, while Eveready Industries has declared a dividend, the total returns over various periods show a mix of negative and positive performance, with significant gains over the 5-year period but recent declines in shorter terms.

View full answer

Who are the peers of the Eveready Inds.?

03-Jun-2025

Eveready Inds. peers include Hind. Unilever, ITC, Nestle India, Britannia Inds., and others, with varying management risks and capital structures. Eveready Inds. has a 1-year return of -8.15%, outperforming HMA Agro Inds. but underperforming Vadilal Enterp. at 219.04%.

Peers: The peers of Eveready Inds. are Hind. Unilever, ITC, Nestle India, Britannia Inds., Godrej Consumer, HMA Agro Inds., Andrew Yule & Co, Godavari Bioref., Lotus Chocolate, and Vadilal Enterp.<BR><BR>Quality Snapshot: Excellent management risk is observed at ITC, Nestle India, and Britannia Inds., while Good management risk is found at Hind. Unilever, Godrej Consumer, and Eveready Inds. Average management risk is present at HMA Agro Inds., Godavari Bioref., and Lotus Chocolate, while Below Average management risk is noted at Andrew Yule & Co. Growth is Excellent at Lotus Chocolate, Average at Nestle India, and Below Average at Hind. Unilever, ITC, Britannia Inds., Godrej Consumer, Eveready Inds., HMA Agro Inds., Andrew Yule & Co, and the rest. Capital Structure is Excellent at Hind. Unilever, ITC, Nestle India, Britannia Inds., Godrej Consumer, while Eveready Inds. has an Average capital structure, and HMA Agro Inds., Andrew Yule & Co, Godavari Bioref., and Lotus Chocolate have Below Average capital structures.<BR><BR>Return Snapshot: The peer with the highest 1-year return is Vadilal Enterp. at 219.04%, while the lowest is HMA Agro Inds. at -28.09%. Eveready Inds. has a 1-year return of -8.15%, which is higher than HMA Agro Inds. but lower than Vadilal Enterp. Additionally, the six-month return is negative for Eveready Inds., HMA Agro Inds., Andrew Yule & Co, Godavari Bioref., and Lotus Chocolate.

View full answer

Who are in the management team of Eveready Inds.?

16-Jul-2025

As of March 2022, the management team of Eveready Industries includes Suvamoy Saha (Managing Director), Anand C Burman (Chairman), and several independent directors such as Mahesh Shah and Roshan L Joseph, among others, totaling 13 members. This diverse team oversees the company's governance and management.

As of March 2022, the management team of Eveready Industries includes the following members:<BR><BR>1. T Punwani - Vice President & Company Secretary<BR>2. Mahesh Shah - Independent Director<BR>3. Roshan L Joseph - Independent Director<BR>4. Suvamoy Saha - Managing Director<BR>5. Arundhuti Dhar - Independent Director<BR>6. Utsav Parekh - Director<BR>7. Sourav Bhagat - Independent Director<BR>8. Girish Mehta - Director<BR>9. Sunil Sikka - Independent Director<BR>10. Anand C Burman - Chairman (Non-Executive)<BR>11. Mohit Burman - Director<BR>12. Sunil Kumar Alagh - Independent Director<BR>13. Arjun Lamba - Director<BR><BR>This diverse team includes various independent directors and executives, contributing to the governance and management of the company.

View full answer

How big is Eveready Inds.?

24-Jul-2025

As of 24th July, Eveready Industries India Ltd has a market capitalization of 3,114.00 Cr, with recent net sales of 1,344.52 Cr and a net profit of 82.44 Cr over the last four quarters.

As of 24th July, <BR><BR>Market Cap: Eveready Industries India Ltd has a market capitalization of 3,114.00 Cr, categorizing it as a Small Cap company.<BR><BR>Recent Quarterly Performance: The sum of Net Sales for the latest 4 quarters is 1,344.52 Cr, while the sum of Net Profit for the same period is 82.44 Cr.<BR><BR>Balance Sheet Snapshot: The reporting period is March 2025, with Shareholder's Funds amounting to 461.11 Cr and Total Assets totaling 924.82 Cr.

View full answer

How has been the historical performance of Eveready Inds.?

06-Nov-2025

Eveready Inds. has shown fluctuating financial performance, with net sales increasing slightly to 1,344.52 Cr in Mar'25, while profit after tax rose significantly to 82.44 Cr. Despite challenges in sales and cash flow, the company improved profitability and asset management.

Answer:<BR>The historical performance of Eveready Inds. shows a fluctuating trend in key financial metrics over the years.<BR><BR>Breakdown:<BR>Eveready Inds. reported net sales of 1,344.52 Cr in Mar'25, a slight increase from 1,314.28 Cr in Mar'24, but a decrease from 1,506.64 Cr in Mar'19. The total operating income followed a similar pattern, reaching 1,344.52 Cr in Mar'25. The total expenditure, excluding depreciation, was 1,192.15 Cr in Mar'25, up from 1,173.96 Cr in Mar'24. Operating profit (PBDIT) increased to 153.85 Cr in Mar'25 from 143.21 Cr in Mar'24, while profit before tax also rose to 98.51 Cr in Mar'25 compared to 80.64 Cr in Mar'24. The profit after tax saw a significant increase to 82.44 Cr in Mar'25 from 66.76 Cr in Mar'24. The earnings per share (EPS) improved to 11.34 in Mar'25, up from 9.19 in Mar'24. On the balance sheet, total assets increased to 924.82 Cr in Mar'25 from 802.35 Cr in Mar'24, while total liabilities also rose to 924.82 Cr in Mar'25. Cash flow from operating activities was 129 Cr in Mar'25, down from 153 Cr in Mar'24, with a net cash outflow of 1 Cr in Mar'25. Overall, the company has shown improvements in profitability and asset management despite fluctuations in sales and cash flow.

View full answer

Is Eveready Inds. overvalued or undervalued?

07-Nov-2025

As of November 6, 2025, Eveready Industries is considered overvalued with a PE ratio of 29.65 and an EV to EBITDA of 28.13, showing a decline of 10.02% in stock performance over the past year compared to a 3.65% gain in the Sensex.

As of 6 November 2025, Eveready Industries has moved from a very attractive to an attractive valuation grade. The company is currently considered overvalued. Key ratios include a PE ratio of 29.65, an EV to EBITDA of 28.13, and a Price to Book Value of 0.56. <BR><BR>In comparison to peers, Eveready’s PE ratio is lower than Exide Industries, which stands at 38.08, but higher than Amara Raja Energy at 23.19. The EV to EBITDA ratio also indicates a premium compared to Amara Raja Energy, which has a ratio of 11.56. Recent stock performance shows a decline of 10.02% over the past year, contrasting with a 3.65% gain in the Sensex, further supporting the view that the stock may be overvalued at its current price of 364.70.

View full answer

Is Eveready Inds. technically bullish or bearish?

24-Nov-2025

As of November 21, 2025, Eveready Industries shows a mildly bearish trend due to negative indicators from MACD, Bollinger Bands, and KST, despite a mildly bullish daily moving average, and has underperformed against the Sensex.

As of 21 November 2025, the technical trend for Eveready Inds. has changed from sideways to mildly bearish. The current stance is mildly bearish, driven by a bearish MACD on the weekly timeframe and bearish signals from Bollinger Bands across both weekly and monthly periods. The KST is also mildly bearish on the weekly and bearish on the monthly. Although the daily moving averages indicate a mildly bullish trend, the overall sentiment remains negative due to the prevailing bearish indicators. The stock has underperformed significantly compared to the Sensex over multiple timeframes, further supporting the bearish outlook.

View full answer

Are Eveready Industries India Ltd latest results good or bad?

06-Feb-2026

Eveready Industries India Ltd's latest Q3 FY26 results show mixed performance: revenue grew by 10.12% to ₹367.24 crores, but net profit plummeted by 43.13% to ₹7.45 crores, indicating challenges in maintaining profitability despite sales growth.

Eveready Industries India Ltd's latest results for Q3 FY26 present a mixed picture, leaning towards the negative. While the company achieved a revenue growth of 10.12% year-on-year, reaching ₹367.24 crores, its net profit saw a significant decline of 43.13%, dropping to ₹7.45 crores. This sharp decrease in profitability highlights a troubling trend, as the profit after tax margin fell to just 2.03%, down from 3.93% in the same quarter last year.<BR><BR>The operating margin also showed signs of stress, standing at 8.98%, which, although slightly improved from the previous year, is a stark decline from 12.69% in the preceding quarter. This suggests that while sales are increasing, the company is struggling to convert that growth into profit, likely due to rising costs or competitive pressures.<BR><BR>Overall, the results indicate that Eveready is facing significant challenges in maintaining profitability despite top-line growth, raising concerns about its operational efficiency and sustainability moving forward.

View full answer

Should I buy, sell or hold Eveready Industries India Ltd?

06-Feb-2026

Why is Eveready Industries India Ltd falling/rising?

24-Mar-2026

As of 24-Mar, Eveready Industries India Ltd's stock price is rising to Rs 286.00, reflecting short-term investor interest despite longer-term challenges, including a 12.01% decline over the past month and a high Debt to EBITDA ratio of 2.51 times. The stock's performance raises concerns about its future, as it remains close to its 52-week low.

As of 24-Mar, Eveready Industries India Ltd's stock price is rising, currently at Rs 286.00, reflecting an increase of Rs 4.9 or 1.74%. The stock opened with a gain of 2.1% today and reached an intraday high of Rs 288.15. Additionally, there has been a notable increase in investor participation, with delivery volume rising by 43.02% against the 5-day average, indicating growing interest in the stock.<BR><BR>Despite this positive movement, the stock has been underperforming in the longer term, with a decline of 12.01% over the past month and 13.24% year-to-date. It is also trading lower than its moving averages across various periods, which suggests a bearish trend. Furthermore, the stock is close to its 52-week low, being only 4.62% away from Rs 272.8.<BR><BR>While the company shows high management efficiency with a return on capital employed (ROCE) of 16.73% and has generated profits that rose by 11.8% over the past year, it faces challenges such as a high Debt to EBITDA ratio of 2.51 times, indicating a low ability to service debt. This financial strain, combined with poor long-term growth and consistent underperformance against benchmarks, raises concerns about the stock's future performance.<BR><BR>In summary, the current rise in Eveready Industries India Ltd's stock price is driven by short-term investor interest and positive trading activity, but it is juxtaposed against a backdrop of longer-term challenges and underperformance.

View full answer

Why is Eveready Industries India Ltd falling/rising?

25-Mar-2026

As of 25-Mar, Eveready Industries India Ltd's stock price is at Rs 287.25, reflecting a 1.75% increase. This rise is driven by recent gains, increased investor participation, and outperformance against its sector, although it remains below its moving averages.

As of 25-Mar, Eveready Industries India Ltd's stock price is rising, currently at Rs 287.25, reflecting a change of Rs 4.95 or 1.75% increase. This upward movement can be attributed to several factors. Firstly, the stock has been gaining for the last two days, with a total return of 2.19% during this period. Additionally, it opened with a gain of 2.53% today and reached an intraday high of Rs 297, which is a 5.21% increase.<BR><BR>The stock has also outperformed its sector by 0.25%, indicating a relative strength compared to its peers. Furthermore, there has been a notable increase in investor participation, with delivery volume rising by 48.58% against the 5-day average, suggesting heightened interest in the stock.<BR><BR>Despite these positive indicators, it is important to note that the stock is trading below its moving averages across various time frames, which could indicate underlying weaknesses. However, the current rise in price is primarily driven by short-term gains and increased trading activity.

View full answer
iScoreScore
Click here to find our call on this stock
Strong Sell
Sell
Hold
Buy
Strong Buy

Dashboard

1

Low ability to service debt as the company has a high Debt to EBITDA ratio of 2.51 times

  • Low ability to service debt as the company has a high Debt to EBITDA ratio of 2.51 times
2

Poor long term growth as Operating profit has grown by an annual rate -6.60% of over the last 5 years

 
3

Flat results in Dec 25

 
4

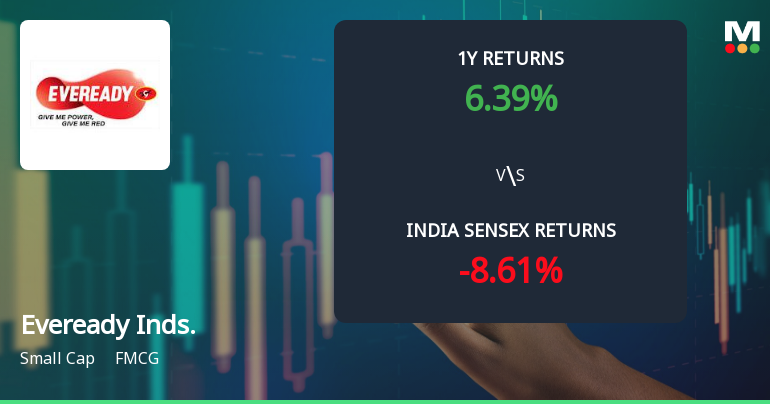
Consistent Underperformance against the benchmark over the last 3 years

stock-summaryMojo Parameters

Mojo Parameters

Loading Valuation Snapshot...

Stock DNA

stock-summary
Industry

FMCG

stock-summary
Market cap

INR 2,120 Cr (Small Cap)

stock-summary
P/E

23.00

stock-summary
Industry P/E

24

stock-summary
Dividend Yield

0.52%

stock-summary
Debt Equity

0.74

stock-summary
Return on Equity

18.91%

stock-summary
Price to Book

4.40

Revenue and Profits:
Net Sales:
367 Cr
(Quarterly Results - Dec 2025)
Net Profit:
7 Cr
stock-summaryTotal Returns
Total Returns (Price + Dividend) stock-summary
Dividend Yield (0.52%)
TimePeriod
Price Return
Dividend Return
Total Return
3 Months
-13.1%
0%
-13.1%
6 Months
-27.85%
0%
-27.85%
1 Year
-5.95%
0.49%
-5.46%
2 Years
-14.08%
0.74%
-13.34%
3 Years
0.85%
0.84%
1.69%
4 Years
-17.1%
0.78%
-16.32%
5 Years
11.12%
0.87%
11.99%

Latest dividend: 1.5 per share ex-dividend date: Jul-29-2025

Risk Adjusted Returns v/s stock-summary
Returns Beta
Icon
Beta has not been calculated since enough price history is not available
stock-summaryNews & Corporate Actions

News

Why is Eveready Industries India Ltd falling/rising?

Recent Price Movement and Market Context

Eveready Industries’ stock has underperformed both the benchmark Sensex and its sector peers over multiple time frames. In the past week, the stock declined by 6.55%, nearly double the Sensex’s 3.72% fall. Over the last month and year-to-date, the stock has dropped by 14.31% and 14.89% respectively, marginally worse than the Sensex’s corresponding declines of 12.72% and 14.70%. This persistent underperformance is further underscored by the stock’s 1-year return of -9.35%, which trails the Sensex’s 5.47% gain. Over a three-year horizon, the stock has barely moved, declining 1.21%, while the Sensex surged 25.50%. Even over five years, Eveready’s 4.06% gain pales in comparison to the benchmark’s 45.24% rise.

On the day of the decli...

Read full news article
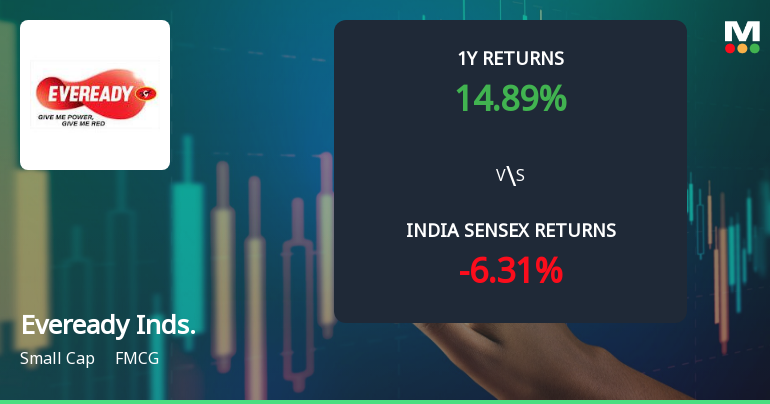
Announcements stock-summary

Eveready Industries India Limited - Updates

14-Nov-2019 | Source : NSE

Eveready Industries India Limited has informed the Exchange regarding 'Pursuant to the provisrons of Regulation 47 of the SEBI (Listing Obligations and Disclosure Requirements), Regulations, 2015, and further to our letter of November 12, 2019, we enclose a copy of

Eveready Industries India Limited - Limited Review Report

13-Nov-2019 | Source : NSE

Eveready Industries India Limited has informed the Exchange regarding Limited Review Report for the Quarter ended September 30, 2019

Eveready Industries India Limited - Updates

06-Nov-2019 | Source : NSE

Eveready Industries India Limited has informed the Exchange regarding 'Pursuant to the provisions of Regulation 47 of the SEBI (Listing Obligations and Disclosure Requirements), Regulations, 2015 and further to our letter of November 04, 2019 we enclose a copy of the advertisement which was published in Financial Express and Aajkaal on Tuesday, November 05,2019.'.

Corporate Actions stock-summary

stock-summary
BOARD MEETING

No Upcoming Board Meetings

stock-summary
DIVIDEND

Eveready Industries India Ltd has declared 30% dividend, ex-date: 29 Jul 25

stock-summary
SPLITS

No Splits history available

stock-summary
BONUS

No Bonus history available

stock-summary
RIGHTS

No Rights history available

stock-summaryKey Factors

Quality key factors stock-summary

Factor
Value
Sales Growth (5y)
3.52%
EBIT Growth (5y)
-6.60%
EBIT to Interest (avg)
3.42
Debt to EBITDA (avg)
2.63
Net Debt to Equity (avg)
0.74
Sales to Capital Employed (avg)
1.80
Tax Ratio
33.22%
Dividend Payout Ratio
13.22%
Pledged Shares
5.32%
Institutional Holding
7.80%
ROCE (avg)
17.48%
ROE (avg)
29.79%

Valuation key factors

Factor
Value
P/E Ratio
23
Industry P/E
24
Price to Book Value
4.42
EV to EBIT
18.45
EV to EBITDA
15.10
EV to Capital Employed
2.96
EV to Sales
1.71
PEG Ratio
1.98
Dividend Yield
0.52%
ROCE (Latest)
15.61%
ROE (Latest)
18.91%

Technicals key factors

Indicator
Weekly
Monthly
MACD
Bearish
Bearish
RSI
No Signal
No Signal
Bollinger Bands
Bearish
Bearish
Moving Averages
Bearish (Daily)
KST
Mildly Bullish
Mildly Bullish
Dow Theory
Mildly Bearish
Mildly Bearish
OBV
Mildly Bearish
Mildly Bullish
stock-summary Technical Indicator Scale: Bearish, Mildly Bearish, Sideways, Mildly Bullish, Bullish  Turned 
stock-summaryShareholding
Shareholding Snapshot : Dec 2025stock-summary
Shareholding Compare (%holding) stock-summary
Majority shareholders

Non Institution

Pledged Promoter Holdings

5.3193

Mutual Funds

Held by 5 Schemes (2.65%)

FIIs

Held by 37 FIIs (5.05%)

Promoter with highest holding

M B Finmart Private Limited (11.81%)

Highest Public shareholder

Theleme India Master Fund Limited (4.31%)

Individual Investors Holdings

22.17%

stock-summaryFinancial
[
  {
    "link": "quarterly",
    "btn_text": "All Quarterly Results",
    "header": "Quarterly Results Snapshot (Consolidated) - Dec'25 - YoY",
    "rhs": [
      {
        "prefix": "Net Sales ",
        "suffix": "YoY Growth in quarter ended Dec 2025 is 10.12% vs 9.38% in Dec 2024",
        "dir": 1
      },
      {
        "prefix": "Consolidated Net Profit ",
        "suffix": "YoY Growth in quarter ended Dec 2025 is -43.13% vs 55.77% in Dec 2024",
        "dir": -1
      }
    ],
    "table": {
      "header": [
        "Dec'25",
        "Dec'24",
        "Change(%)"
      ],
      "body": [
        {
          "field": "Net Sales",
          "val1": "367.24",
          "val2": "333.50",
          "chgp": "10.12%",
          "chgp_class": "positive"
        },
        {
          "field": "Operating Profit (PBDIT) excl Other Income",
          "val1": "32.99",
          "val2": "29.22",
          "chgp": "12.90%",
          "chgp_class": "positive"
        },
        {
          "field": "Interest",
          "val1": "4.76",
          "val2": "6.59",
          "chgp": "-27.77%",
          "chgp_class": "positive"
        },
        {
          "field": "Exceptional Items",
          "val1": "-9.38",
          "val2": "0.00",
          "chgp": "",
          "chgp_class": "neutral"
        },
        {
          "field": "Consolidate Net Profit",
          "val1": "7.45",
          "val2": "13.10",
          "chgp": "-43.13%",
          "chgp_class": "negative"
        },
        {
          "field": "Operating Profit Margin (Excl OI)",
          "val1": "8.98%",
          "val2": "8.76%",
          "chgp": "0.22%",
          "chgp_class": "positive"
        }
      ]
    }
  },
  {
    "link": "half-yearly",
    "btn_text": "All Half Yearly Results",
    "header": "Half Yearly Results Snapshot (Consolidated) - Sep'25",
    "rhs": [
      {
        "prefix": "Net Sales ",
        "suffix": " Growth in half year ended Sep 2025 is 6.87% vs -2.26% in Sep 2024",
        "dir": 1
      },
      {
        "prefix": "Consolidated Net Profit ",
        "suffix": " Growth in half year ended Sep 2025 is -62.12% vs 17.14% in Sep 2024",
        "dir": -1
      }
    ],
    "table": {
      "header": [
        "Sep'25",
        "Sep'24",
        "Change(%)"
      ],
      "body": [
        {
          "field": "Net Sales",
          "val1": "760.92",
          "val2": "711.98",
          "chgp": "6.87%",
          "chgp_class": "positive"
        },
        {
          "field": "Operating Profit (PBDIT) excl Other Income",
          "val1": "102.78",
          "val2": "97.54",
          "chgp": "5.37%",
          "chgp_class": "positive"
        },
        {
          "field": "Interest",
          "val1": "10.59",
          "val2": "13.29",
          "chgp": "-20.32%",
          "chgp_class": "positive"
        },
        {
          "field": "Exceptional Items",
          "val1": "-44.75",
          "val2": "0.00",
          "chgp": "",
          "chgp_class": "neutral"
        },
        {
          "field": "Consolidate Net Profit",
          "val1": "22.32",
          "val2": "58.92",
          "chgp": "-62.12%",
          "chgp_class": "negative"
        },
        {
          "field": "Operating Profit Margin (Excl OI)",
          "val1": "13.51%",
          "val2": "13.70%",
          "chgp": "-0.19%",
          "chgp_class": "negative"
        }
      ]
    }
  },
  {
    "link": "nine-monthly",
    "btn_text": "All Nine Monthly Results",
    "header": "Nine Monthly Results Snapshot (Consolidated) - Dec'25",
    "rhs": [
      {
        "prefix": "Net Sales ",
        "suffix": "YoY Growth in nine months ended Dec 2025 is 7.91% vs 1.17% in Dec 2024",
        "dir": 1
      },
      {
        "prefix": "Consolidated Net Profit ",
        "suffix": "YoY Growth in nine months ended Dec 2025 is -58.66% vs 22.67% in Dec 2024",
        "dir": -1
      }
    ],
    "table": {
      "header": [
        "Dec'25",
        "Dec'24",
        "Change(%)"
      ],
      "body": [
        {
          "field": "Net Sales",
          "val1": "1,128.16",
          "val2": "1,045.48",
          "chgp": "7.91%",
          "chgp_class": "positive"
        },
        {
          "field": "Operating Profit (PBDIT) excl Other Income",
          "val1": "135.77",
          "val2": "126.76",
          "chgp": "7.11%",
          "chgp_class": "positive"
        },
        {
          "field": "Interest",
          "val1": "15.35",
          "val2": "19.88",
          "chgp": "-22.79%",
          "chgp_class": "positive"
        },
        {
          "field": "Exceptional Items",
          "val1": "-54.13",
          "val2": "0.00",
          "chgp": "",
          "chgp_class": "neutral"
        },
        {
          "field": "Consolidate Net Profit",
          "val1": "29.77",
          "val2": "72.02",
          "chgp": "-58.66%",
          "chgp_class": "negative"
        },
        {
          "field": "Operating Profit Margin (Excl OI)",
          "val1": "12.03%",
          "val2": "12.12%",
          "chgp": "-0.09%",
          "chgp_class": "negative"
        }
      ]
    }
  },
  {
    "link": "annual",
    "btn_text": "All Annual Results",
    "header": "Annual Results Snapshot (Consolidated) - Mar'25",
    "rhs": [
      {
        "prefix": "Net Sales ",
        "suffix": "YoY Growth in year ended Mar 2025 is 2.30% vs -1.01% in Mar 2024",
        "dir": 1
      },
      {
        "prefix": "Consolidated Net Profit ",
        "suffix": "YoY Growth in year ended Mar 2025 is 23.49% vs 141.62% in Mar 2024",
        "dir": -1
      }
    ],
    "table": {
      "header": [
        "Mar'25",
        "Mar'24",
        "Change(%)"
      ],
      "body": [
        {
          "field": "Net Sales",
          "val1": "1,344.52",
          "val2": "1,314.28",
          "chgp": "2.30%",
          "chgp_class": "positive"
        },
        {
          "field": "Operating Profit (PBDIT) excl Other Income",
          "val1": "152.37",
          "val2": "140.32",
          "chgp": "8.59%",
          "chgp_class": "positive"
        },
        {
          "field": "Interest",
          "val1": "25.70",
          "val2": "32.31",
          "chgp": "-20.46%",
          "chgp_class": "positive"
        },
        {
          "field": "Exceptional Items",
          "val1": "0.00",
          "val2": "0.00",
          "chgp": "",
          "chgp_class": "neutral"
        },
        {
          "field": "Consolidate Net Profit",
          "val1": "82.44",
          "val2": "66.76",
          "chgp": "23.49%",
          "chgp_class": "positive"
        },
        {
          "field": "Operating Profit Margin (Excl OI)",
          "val1": "11.33%",
          "val2": "10.68%",
          "chgp": "0.65%",
          "chgp_class": "positive"
        }
      ]
    }
  }
]

Quarterly Results Snapshot (Consolidated) - Dec'25 - YoYstock-summary

Dec'25
Dec'24
Change(%)
Net Sales
367.24
333.50
10.12%
Operating Profit (PBDIT) excl Other Income
32.99
29.22
12.90%
Interest
4.76
6.59
-27.77%
Exceptional Items
-9.38
0.00
Consolidate Net Profit
7.45
13.10
-43.13%
Operating Profit Margin (Excl OI)
8.98%
8.76%
0.22%
Values in Rs Cr.
Direction Arrows
Net Sales

YoY Growth in quarter ended Dec 2025 is 10.12% vs 9.38% in Dec 2024

Direction Arrows
Consolidated Net Profit

YoY Growth in quarter ended Dec 2025 is -43.13% vs 55.77% in Dec 2024

Half Yearly Results Snapshot (Consolidated) - Sep'25stock-summary

Sep'25
Sep'24
Change(%)
Net Sales
760.92
711.98
6.87%
Operating Profit (PBDIT) excl Other Income
102.78
97.54
5.37%
Interest
10.59
13.29
-20.32%
Exceptional Items
-44.75
0.00
Consolidate Net Profit
22.32
58.92
-62.12%
Operating Profit Margin (Excl OI)
13.51%
13.70%
-0.19%
Values in Rs Cr.
Direction Arrows
Net Sales

Growth in half year ended Sep 2025 is 6.87% vs -2.26% in Sep 2024

Direction Arrows
Consolidated Net Profit

Growth in half year ended Sep 2025 is -62.12% vs 17.14% in Sep 2024

Nine Monthly Results Snapshot (Consolidated) - Dec'25stock-summary

Dec'25
Dec'24
Change(%)
Net Sales
1,128.16
1,045.48
7.91%
Operating Profit (PBDIT) excl Other Income
135.77
126.76
7.11%
Interest
15.35
19.88
-22.79%
Exceptional Items
-54.13
0.00
Consolidate Net Profit
29.77
72.02
-58.66%
Operating Profit Margin (Excl OI)
12.03%
12.12%
-0.09%
Values in Rs Cr.
Direction Arrows
Net Sales

YoY Growth in nine months ended Dec 2025 is 7.91% vs 1.17% in Dec 2024

Direction Arrows
Consolidated Net Profit

YoY Growth in nine months ended Dec 2025 is -58.66% vs 22.67% in Dec 2024

Annual Results Snapshot (Consolidated) - Mar'25stock-summary

Mar'25
Mar'24
Change(%)
Net Sales
1,344.52
1,314.28
2.30%
Operating Profit (PBDIT) excl Other Income
152.37
140.32
8.59%
Interest
25.70
32.31
-20.46%
Exceptional Items
0.00
0.00
Consolidate Net Profit
82.44
66.76
23.49%
Operating Profit Margin (Excl OI)
11.33%
10.68%
0.65%
Values in Rs Cr.
Direction Arrows
Net Sales

YoY Growth in year ended Mar 2025 is 2.30% vs -1.01% in Mar 2024

Direction Arrows
Consolidated Net Profit

YoY Growth in year ended Mar 2025 is 23.49% vs 141.62% in Mar 2024

stock-summaryCompany CV
About Eveready Industries India Ltd stock-summary
stock-summary
Eveready Industries India Ltd
Small Cap
FMCG
Eveready Industries India Limited (EIIL) was incorporated on June 24, 1934 as a Public Limited Company. The Company was formerly a subsidiary of Union Carbide Corporation, US and was subsequently taken over by B M Khaitan and the Williamson Magor Group of Companies. The name of the Company was changed to Eveready Industries Ltd., eleven years after its Bhopal plant was involved in one of the world's worst industrial disasters.
Company Coordinates stock-summary
Company Details
2 Rainey Park , Kolkata West Bengal : 700019
stock-summary
Tel: 91-33-24559213/24864961
stock-summary
investorrelation@eveready.co.in
Registrar Details