
Compare Everest Inds. with Similar Stocks
Dashboard
With a Operating Losses, the company has a Weak Long Term Fundamental Strength
- The company has been able to generate a Return on Equity (avg) of 3.48% signifying low profitability per unit of shareholders funds
With a fall in Net Sales of -27.72%, the company declared Very Negative results in Mar 26
Risky - Negative EBITDA
Despite the size of the company, domestic mutual funds hold only 0.05% of the company
Consistent Underperformance against the benchmark over the last 3 years
Stock DNA
Miscellaneous
INR 549 Cr (Micro Cap)
NA (Loss Making)
12
0.74%
0.37
-17.81%
1.08
Total Returns (Price + Dividend) 
Latest dividend: 2.5 per share ex-dividend date: Sep-12-2025
Risk Adjusted Returns v/s
Returns Beta

News

Everest Industries Ltd is Rated Strong Sell
Everest Industries Ltd is rated Strong Sell by MarketsMOJO, with this rating last updated on 29 September 2025. However, the analysis and financial metrics discussed here reflect the company’s current position as of 04 June 2026, providing investors with an up-to-date view of its fundamentals, valuation, financial trend, and technical outlook.
Read full news articleAre Everest Industries Ltd latest results good or bad?
Everest Industries Ltd's latest financial results for the quarter ended March 2026 reveal significant operational challenges. The company reported a net profit of -₹47.17 crores, marking a substantial decline compared to the previous year, which reflects a severe deterioration in profitability. Revenue for the same quarter was ₹327.17 crores, down 27.72% year-on-year, indicating a persistent weakness in demand and pricing power within a challenging market environment. The operating margin also saw a notable decline, registering at -7.97%, a stark contrast to the positive margin of 2.28% achieved in the same quarter last year. This shift indicates that the company is struggling to cover its basic operating costs, leading to operational distress. Furthermore, the interest coverage ratio fell to -2.81x, the lowest on record for the company, highlighting increasing financial strain due to elevated debt levels ...
Read full news article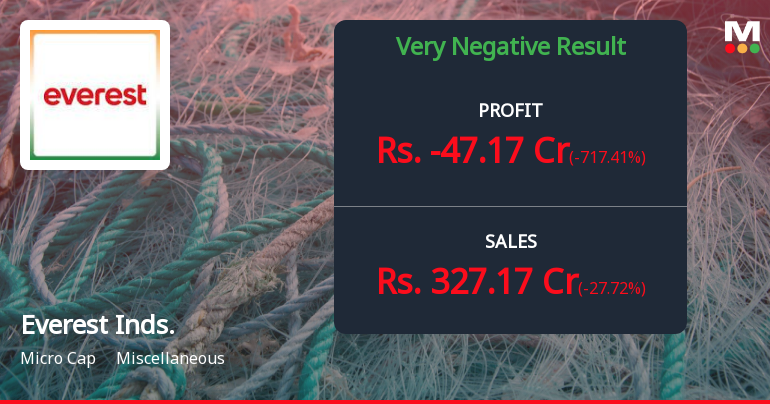
Everest Industries Q4 FY26: Losses Deepen Amid Revenue Decline and Margin Collapse
Everest Industries Ltd., a manufacturer of fibre-based cement products including roofing sheets and pre-fabricated housing solutions, reported a steep quarterly loss of ₹47.17 crores for Q4 FY26, marking a dramatic deterioration from a profit of ₹7.64 crores in the same quarter last year. The micro-cap company, with a market capitalisation of ₹619.64 crores, saw its stock trading at ₹390.80 following the results announcement, down 47.75% from its 52-week high of ₹748.00. The quarter's performance was characterised by a 27.72% year-on-year revenue decline to ₹327.17 crores and a collapse in operating margins to negative 7.97%, raising serious concerns about the company's operational viability and competitive positioning in the building materials sector.
Read full news article Announcements
Compliances-Reg.24(A)-Annual Secretarial Compliance
29-May-2026 | Source : BSEPursuant to Regulation 24A(2) of SEBI (Listing Obligations and Disclosure Requirements) Regulations 2015 we are enclosing herewith the Annual Secretarial Compliance Report of Everest Industries Limited (Company) for the financial year ended March 31 2026 issued by M/s. Parikh & Associates Practicing Company Secretaries.
Corporate Action-Board approves Dividend
26-May-2026 | Source : BSEThe Board at its meeting held today recommended a Final Dividend of Rs. 1.00/- per equity share of face value of Rs. 10/- each for the financial year ended March 31 2026. The above dividend if declared by the members of the Company at the ensuing Annual General Meeting will be paid within 30 days from the date of Annual General Meeting.
Board Meeting Outcome for Outcome Of The Board Meeting - Audited Financial Results Of The Company For The Quarter And Year Ended March 31 2026 And Recommendation Of Final Dividend
26-May-2026 | Source : BSEWe wish to inform you that the Board of Directors of the Company at its meeting held today i.e. May 26 2026 has inter-alia considered and approved Audited Standalone and Consolidated Financial Results of the Company for the quarter and year ended March 31 2026 as recommended by the Audit Committee. Further the Board at its meeting held today recommended a Final Dividend of Rs. 1.00/- per equity share of face value of Rs. 10/- each for the financial year ended March 31 2026. The above dividend if declared by the members of the Company at the ensuing Annual General Meeting will be paid within 30 days from the date of Annual General Meeting.
Corporate Actions

No Upcoming Board Meetings

Everest Industries Ltd has declared 25% dividend, ex-date: 12 Sep 25

No Splits history available

No Bonus history available

No Rights history available
Quality key factors
Valuation key factors
Technicals key factors
 Technical Indicator Scale: Bearish, Mildly Bearish, Sideways, Mildly Bullish, Bullish Turned
 Shareholding Snapshot : Mar 2026
Shareholding Compare (%holding)
Promoters
None
Held by 2 Schemes (0.03%)
Held by 15 FIIs (10.29%)
Falak Investment Private Limited (50.22%)
Massachusetts Institute Of Technology (9.93%)
28.81%
Quarterly Results Snapshot (Consolidated) - Mar'26 - YoY

YoY Growth in quarter ended Mar 2026 is -27.72% vs 4.75% in Mar 2025
YoY Growth in quarter ended Mar 2026 is -717.41% vs 40.44% in Mar 2025
Half Yearly Results Snapshot (Consolidated) - Sep'25
Growth in half year ended Sep 2025 is -10.26% vs 13.57% in Sep 2024
Growth in half year ended Sep 2025 is -491.02% vs -64.00% in Sep 2024
Nine Monthly Results Snapshot (Consolidated) - Dec'25
YoY Growth in nine months ended Dec 2025 is -14.20% vs 11.09% in Dec 2024
YoY Growth in nine months ended Dec 2025 is -384.62% vs -189.57% in Dec 2024
Annual Results Snapshot (Consolidated) - Mar'26
YoY Growth in year ended Mar 2026 is -17.75% vs 9.35% in Mar 2025
YoY Growth in year ended Mar 2026 is -2,724.72% vs -120.00% in Mar 2025
About Everest Industries Ltd

Company Coordinates


