
Compare Everest Kanto with Similar Stocks
Dashboard
Poor long term growth as Net Sales has grown by an annual rate of 9.15% and Operating profit at 3.32% over the last 5 years
Flat results in Mar 26
Despite the size of the company, domestic mutual funds hold only 0% of the company
Consistent Underperformance against the benchmark over the last 3 years
Stock DNA
Industrial Manufacturing
INR 1,384 Cr (Micro Cap)
10.00
20
0.56%
0.08
10.35%
1.01
Total Returns (Price + Dividend) 
Latest dividend: 0.7 per share ex-dividend date: Aug-14-2025
Risk Adjusted Returns v/s
Returns Beta

News
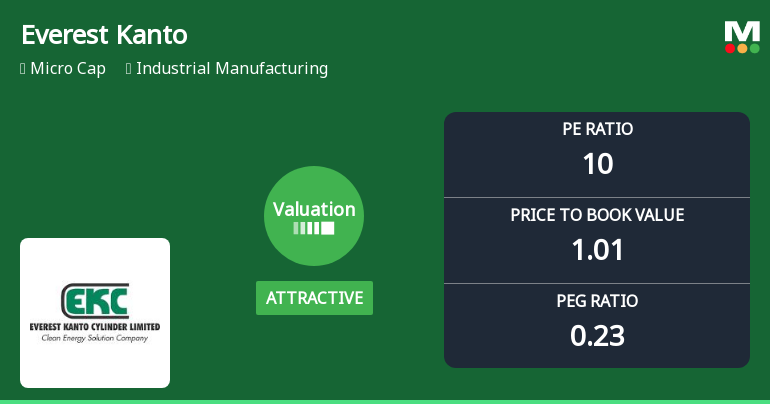
Everest Kanto Cylinder Ltd Valuation Improves Amid Strong Price Rally
Everest Kanto Cylinder Ltd has witnessed a notable shift in its valuation parameters, moving from a very attractive to an attractive rating, reflecting a renewed price appeal for investors. With a current price of ₹125.85 and a day gain of 11.27%, the micro-cap industrial manufacturing company is showing signs of improved market sentiment amid a backdrop of mixed sectoral and benchmark returns.
Read full news article
Everest Kanto Cylinder Ltd is Rated Sell
Everest Kanto Cylinder Ltd is rated 'Sell' by MarketsMOJO, with this rating last updated on 13 February 2026. However, the analysis and financial metrics discussed here reflect the stock's current position as of 20 June 2026, providing investors with an up-to-date view of the company’s fundamentals, valuation, financial trends, and technical outlook.
Read full news article
Everest Kanto Cylinder Ltd is Rated Sell
Everest Kanto Cylinder Ltd is rated 'Sell' by MarketsMOJO, with this rating last updated on 13 February 2026. However, the analysis and financial metrics discussed here reflect the stock's current position as of 09 June 2026, providing investors with an up-to-date perspective on the company’s performance and outlook.
Read full news article Announcements
Announcement under Regulation 30 (LODR)-Analyst / Investor Meet - Outcome
10-Jun-2026 | Source : BSEWe enclose herewith the transcript of the Earning Group Conference.
Announcement under Regulation 30 (LODR)-Analyst / Investor Meet - Outcome
03-Jun-2026 | Source : BSEWe enclose herewith the weblink of the Audio Recording of the Earnings Group Conference Call held today 03-06-2026.
Announcement under Regulation 30 (LODR)-Investor Presentation
01-Jun-2026 | Source : BSEWe enclose herewith Investor Presentation for Q4 and FY26 Results.
Corporate Actions

No Upcoming Board Meetings

Everest Kanto Cylinder Ltd has declared 35% dividend, ex-date: 14 Aug 25

Everest Kanto Cylinder Ltd has announced 2:10 stock split, ex-date: 21 Aug 07

No Bonus history available

No Rights history available
Quality key factors
Valuation key factors
Technicals key factors
 Technical Indicator Scale: Bearish, Mildly Bearish, Sideways, Mildly Bullish, Bullish Turned
 Shareholding Snapshot : Mar 2026
Shareholding Compare (%holding)
Promoters
None
Held by 0 Schemes
Held by 25 FIIs (1.24%)
Suman Premkumar Khurana (24.4%)
None
26.49%
Quarterly Results Snapshot (Consolidated) - Mar'26 - QoQ

QoQ Growth in quarter ended Mar 2026 is -1.89% vs 1.31% in Dec 2025
QoQ Growth in quarter ended Mar 2026 is 28.61% vs 161.08% in Dec 2025
Half Yearly Results Snapshot (Consolidated) - Sep'25
Growth in half year ended Sep 2025 is 5.24% vs 25.09% in Sep 2024
Growth in half year ended Sep 2025 is -1.89% vs 38.35% in Sep 2024
Nine Monthly Results Snapshot (Consolidated) - Dec'25
YoY Growth in nine months ended Dec 2025 is 3.28% vs 20.06% in Dec 2024

YoY Growth in nine months ended Dec 2025 is 19.30% vs -0.14% in Dec 2024
Annual Results Snapshot (Consolidated) - Mar'26
YoY Growth in year ended Mar 2026 is -1.91% vs 22.59% in Mar 2025
YoY Growth in year ended Mar 2026 is 49.95% vs -1.31% in Mar 2025
About Everest Kanto Cylinder Ltd

Company Coordinates


