
Compare Evergy, Inc. with Similar Stocks
Total Returns (Price + Dividend) 
TimePeriod
Price Return
Dividend Return
Total Return
3 Months
22.68%
0%
22.68%
6 Months
22.68%
0%
22.68%
1 Year
8.75%
0%
8.75%
2 Years
12.0%
0%
12.0%
3 Years
53.88%
0%
53.88%
4 Years
19.08%
0%
19.08%
5 Years
35.12%
0%
35.12%
Evergy, Inc. for the last several years.
Risk Adjusted Returns v/s
News
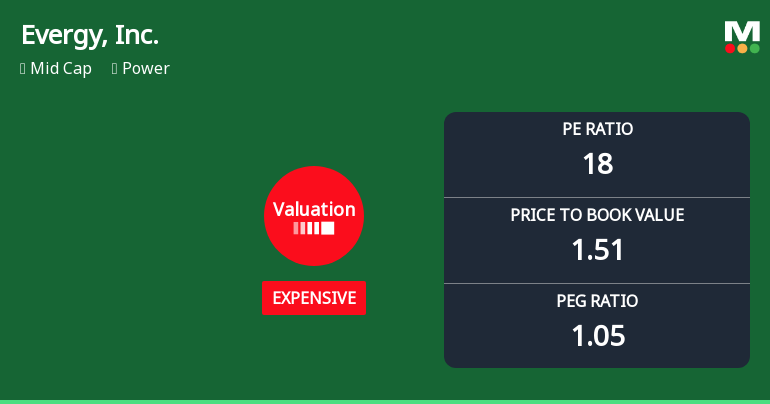
Evergy, Inc. Experiences Revision in Its Stock Evaluation Amid Competitive Market Landscape
Evergy, Inc. has recently adjusted its valuation, with a P/E ratio of 18 and a price-to-book value of 1.51. Key metrics include an EV to EBIT of 20.06 and a PEG ratio of 1.05. The company has shown a year-to-date return of 22.81%, surpassing the S&P 500.
Read full news article Announcements

No announcement available
Corporate Actions
No corporate action available
Quality key factors
Factor
Value
Sales Growth (5y)
3.08%
EBIT Growth (5y)
4.11%
EBIT to Interest (avg)
2.96
Debt to EBITDA (avg)
5.26
Net Debt to Equity (avg)
1.45
Sales to Capital Employed (avg)
0.24
Tax Ratio
3.54%
Dividend Payout Ratio
68.51%
Pledged Shares
0
Institutional Holding
98.13%
ROCE (avg)
6.05%
ROE (avg)
8.45%
Valuation key factors
Factor
Value
P/E Ratio
18
Industry P/E
Price to Book Value
1.51
EV to EBIT
20.06
EV to EBITDA
11.09
EV to Capital Employed
1.21
EV to Sales
5.01
PEG Ratio
1.05
Dividend Yield
0.15%
ROCE (Latest)
6.03%
ROE (Latest)
8.59%
Technicals key factors
Indicator
Weekly
Monthly
MACD
Bullish
Bullish
RSI
No Signal
No Signal
Bollinger Bands
Bullish
Bullish
Moving Averages
Bullish (Daily)
KST
Mildly Bearish
Bullish
Dow Theory
Mildly Bullish
Mildly Bullish
OBV
Mildly Bearish
No Trend
 Technical Indicator Scale: Bearish, Mildly Bearish, Sideways, Mildly Bullish, Bullish Turned
 Shareholding Snapshot : Sep 2025
Shareholding Compare (%holding)
Majority shareholders
Domestic Funds
Domestic Funds
Held in 144 Schemes (46.68%)
Foreign Institutions
Held by 268 Foreign Institutions (12.62%)
Strategic Entities with highest holding
Highest Public shareholder
Quarterly Results Snapshot (Consolidated) - Sep'25 - YoY
Sep'25
Sep'24
Change(%)
Net Sales
1,795.90
1,822.20
-1.44%
Operating Profit (PBDIT) excl Other Income
949.20
936.30
1.38%
Interest
152.00
143.90
5.63%
Exceptional Items
14.00
-10.80
229.63%
Consolidate Net Profit
478.00
468.60
2.01%
Operating Profit Margin (Excl OI)
358.90%
350.30%
0.86%
USD in Million.

Net Sales
YoY Growth in quarter ended Sep 2025 is -1.44% vs 9.16% in Sep 2024
Consolidated Net Profit
YoY Growth in quarter ended Sep 2025 is 2.01% vs 32.15% in Sep 2024
Annual Results Snapshot (Consolidated) - Dec'24
Dec'24
Dec'23
Change(%)
Net Sales
5,823.70
5,485.30
6.17%
Operating Profit (PBDIT) excl Other Income
2,614.90
2,398.40
9.03%
Interest
563.10
525.80
7.09%
Exceptional Items
23.60
22.90
3.06%
Consolidate Net Profit
885.80
743.60
19.12%
Operating Profit Margin (Excl OI)
248.00%
229.60%
1.84%
USD in Million.

Net Sales
YoY Growth in year ended Dec 2024 is 6.17% vs -6.38% in Dec 2023
Consolidated Net Profit
YoY Growth in year ended Dec 2024 is 19.12% vs -2.80% in Dec 2023
About Evergy, Inc.

Evergy, Inc.
Power
Evergy, Inc., is an energy company. The Company provides electricity generation, transmission and distribution services. It serves the customers under Westar and KCP&L brand names. It owns, operates and maintains more than 51,000 miles of distribution lines and 13,000 megawatts of generation. Its subsidiaries include Kansas City Power & Light Company (KCP&L) and Westar Energy, Inc.
Company Coordinates
Company Details
1200 Main St , KANSAS CITY MO : 64105-2122


Registrar Details
InfinHub Market Technologies FZ-LLC, Building-2, Unit 112, Dubai Internet City, Dubai, United Arab Emirates
GET THE MARKETSMOJO APP


Company
Stocks
Portfolio


"Investment in securities markets are subject to market risk. Read all the related documents carefully before investing."