
Compare Exato Technologi with Similar Stocks
Dashboard
High Management Efficiency with a high ROCE of 0%
The company is Net-Debt Free
Healthy long term growth as Operating profit has grown by an annual rate 0%
Flat results in Mar 26
With ROE of 18.1, it has a Attractive valuation with a 4.1 Price to Book Value
Falling Participation by Institutional Investors
Stock DNA
Computers - Software & Consulting
INR 362 Cr (Micro Cap)
19.00
20
0.00%
-0.21
18.11%
4.24
Total Returns (Price + Dividend) 
Exato Technologi for the last several years.
Risk Adjusted Returns v/s
Returns Beta

News
Exato Technologies Ltd is Rated Hold
Exato Technologies Ltd is rated 'Hold' by MarketsMOJO, with this rating last updated on 02 June 2026. However, the analysis and financial metrics discussed here reflect the stock's current position as of 03 June 2026, providing investors with the most up-to-date view of the company’s fundamentals and market performance.
Read full news article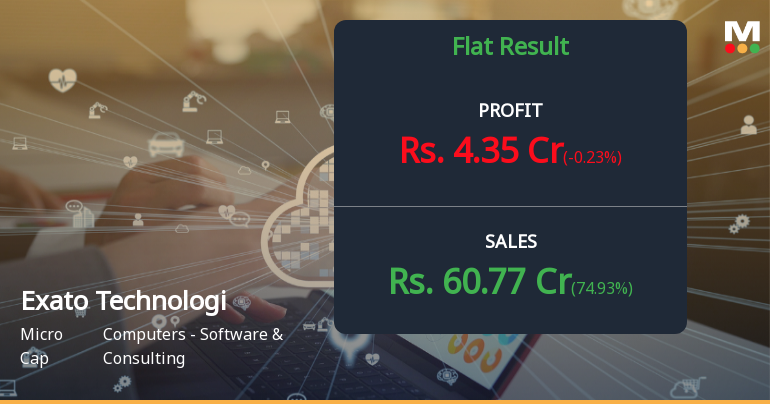
Exato Technologies Q4 FY26: Strong Revenue Surge Masks Margin Compression Concerns
Exato Technologies Limited, a micro-cap software and consulting firm, reported a robust ₹4.24 crores in net profit for Q4 FY26, though the figure declined 7.83% quarter-on-quarter from ₹4.60 crores in Q3 FY26. On a year-on-year basis, the company delivered impressive growth of 72.36% from ₹2.46 crores in Q4 FY25. The stock currently trades at ₹338.00, valuing the company at ₹319.00 crores market capitalisation.
Read full news article Announcements
Announcement under Regulation 30 (LODR)-Earnings Call Transcript
09-Jun-2026 | Source : BSETranscript of the Q4 & FY26 Earnings Call held on June 2 2026 on the Audited Financial Results for the Quarter and Financial Year ended March 31 2026
Announcement under Regulation 30 (LODR)-Analyst / Investor Meet - Outcome
03-Jun-2026 | Source : BSEVideo Recording of Q4 & FY26 Earnings Call held on June 2 2026 on the Audited Financial Results for the Quarter and Financial Year ended March 31 2026
Announcement under Regulation 30 (LODR)-Analyst / Investor Meet - Outcome
03-Jun-2026 | Source : BSEVideo Recording of Q4 & FY26 Earnings Call held on June 2 2026 on the Audited Financial Results for the Quarter and Financial Year ended March 31 2026
Corporate Actions

No Upcoming Board Meetings

No Dividend history available

No Splits history available

No Bonus history available

No Rights history available
Quality key factors
Valuation key factors
Technicals key factors
 Technical Indicator Scale: Bearish, Mildly Bearish, Sideways, Mildly Bullish, Bullish Turned
 Shareholding Snapshot : Mar 2026
Shareholding Compare (%holding)
Promoters
None
Held by 0 Schemes
Held by 0 FIIs
Appuorv K Sinha (53.98%)
Nine Alps Trust-nine Alps Opportunity Fund (6.83%)
24.97%
Quarterly Results Snapshot (Standalone) - Mar'26 - QoQ

QoQ Growth in quarter ended Mar 2026 is 74.93% vs -17.23% in Dec 2025
QoQ Growth in quarter ended Mar 2026 is -0.23% vs -4.39% in Dec 2025
Half Yearly Results Snapshot (Consolidated) - Sep'25
Not Applicable: The company has declared_date for only one period
Not Applicable: The company has declared_date for only one period
Nine Monthly Results Snapshot (Consolidated) - Dec'25
Not Applicable: The company has declared_date for only one period
Not Applicable: The company has declared_date for only one period
Annual Results Snapshot (Consolidated) - Mar'26
YoY Growth in year ended Mar 2026 is 35.23% vs 9.06% in Mar 2025

YoY Growth in year ended Mar 2026 is 66.74% vs 81.73% in Mar 2025
About Exato Technologies Ltd

Company Coordinates


