
Compare Excel Industries with Similar Stocks
Dashboard
Poor long term growth as Operating profit has grown by an annual rate -4.86% of over the last 5 years
Negative results in Mar 26
Despite the size of the company, domestic mutual funds hold only 0.01% of the company
Consistent Underperformance against the benchmark over the last 3 years
Stock DNA
Specialty Chemicals
INR 1,170 Cr (Micro Cap)
15.00
29
1.48%
-0.08
4.44%
0.69
Total Returns (Price + Dividend) 
Latest dividend: 13.816347753743761 per share ex-dividend date: Aug-14-2025
Risk Adjusted Returns v/s
Returns Beta

News

Excel Industries Ltd Technical Momentum Shifts Amid Mixed Market Signals
Excel Industries Ltd, a micro-cap player in the Specialty Chemicals sector, has exhibited a subtle shift in its technical momentum, moving from a bearish to a mildly bearish trend. Despite a modest day gain of 0.96%, the stock’s technical indicators present a complex picture, with some signals suggesting cautious optimism while others maintain a bearish stance. This article analyses the recent technical parameter changes, key momentum indicators, and the stock’s performance relative to the broader market.
Read full news article
Excel Industries Ltd is Rated Sell
Excel Industries Ltd is rated Sell by MarketsMOJO, with this rating last updated on 30 March 2026. However, the analysis and financial metrics presented here reflect the stock's current position as of 17 June 2026, providing investors with the latest insights into the company’s performance and outlook.
Read full news article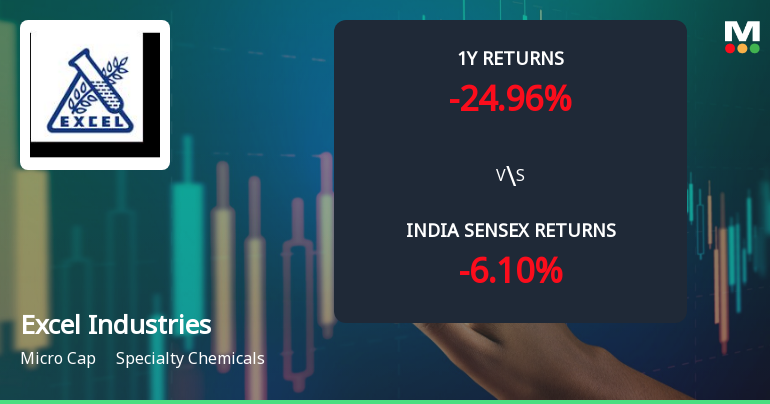
Excel Industries Ltd Technical Momentum Shifts Amid Bearish Trends
Excel Industries Ltd, a micro-cap player in the Specialty Chemicals sector, has experienced a notable shift in its technical momentum, moving from a mildly bearish stance to a more pronounced bearish trend. Despite a marginal day change of 0.02%, the stock’s technical indicators reveal a complex interplay of signals that investors should carefully analyse amid a challenging market backdrop.
Read full news article Announcements
Excel Industries Limited - Other General Purpose
03-Dec-2019 | Source : NSEExcel Industries Limited has informed the Exchange regarding Compliance Pursuant to Regulation 23(9) of the SEBI ( LODR) Regulations, 2015.
Excel Industries Limited - Change in Director(s)
13-Nov-2019 | Source : NSEExcel Industries Limited has informed the Exchange regarding Change in Director(s) of the company.
Excel Industries Limited - Updates
18-Oct-2019 | Source : NSEExcel Industries Limited has informed the Exchange regarding 'Certificate under Regulation 74(5) of SEBI (Depositories and Participants) Regulations, 2018 '.
Corporate Actions

No Upcoming Board Meetings

Excel Industries Ltd has declared 275% dividend, ex-date: 14 Aug 25

No Splits history available

No Bonus history available

No Rights history available
Quality key factors
Valuation key factors
Technicals key factors
 Technical Indicator Scale: Bearish, Mildly Bearish, Sideways, Mildly Bullish, Bullish Turned
 Shareholding Snapshot : Mar 2026
Shareholding Compare (%holding)
Promoters
None
Held by 4 Schemes (0.01%)
Held by 40 FIIs (1.94%)
Anshul Specialty Molecules Private Limited (42.92%)
Life Insurance Corporation Of India (6.69%)
30.64%
Quarterly Results Snapshot (Consolidated) - Mar'26 - QoQ

QoQ Growth in quarter ended Mar 2026 is 20.42% vs -13.58% in Dec 2025
QoQ Growth in quarter ended Mar 2026 is 45.50% vs -60.17% in Dec 2025
Half Yearly Results Snapshot (Consolidated) - Sep'25

Growth in half year ended Sep 2025 is 8.60% vs 29.46% in Sep 2024
Growth in half year ended Sep 2025 is -17.62% vs 770.76% in Sep 2024
Nine Monthly Results Snapshot (Consolidated) - Dec'25
YoY Growth in nine months ended Dec 2025 is 11.37% vs 23.22% in Dec 2024
YoY Growth in nine months ended Dec 2025 is -13.05% vs 605.03% in Dec 2024
Annual Results Snapshot (Consolidated) - Mar'26
YoY Growth in year ended Mar 2026 is 11.91% vs 18.39% in Mar 2025
YoY Growth in year ended Mar 2026 is -11.30% vs 401.53% in Mar 2025
About Excel Industries Ltd

Company Coordinates


