
Compare Explicit Finance with Similar Stocks
Stock DNA
Diversified Commercial Services
INR 7 Cr (Micro Cap)
NA (Loss Making)
18
0.00%
0.00
-0.13%
0.89
Total Returns (Price + Dividend) 
Explicit Finance for the last several years.
Risk Adjusted Returns v/s
Returns Beta

News

Explicit Finance Ltd Valuation Shifts Signal Elevated Price Risks
Explicit Finance Ltd, a micro-cap player in the diversified commercial services sector, has seen a marked deterioration in its valuation attractiveness, with key metrics signalling a shift from risky to very expensive territory. This article analyses the recent changes in price-to-earnings and price-to-book value ratios, compares them with peer averages and historical benchmarks, and assesses the implications for investors amid a challenging market backdrop.
Read full news article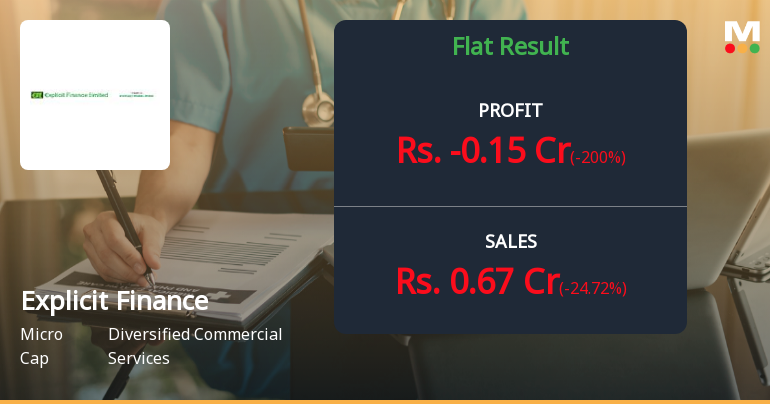
Explicit Finance Q4 FY26: Losses Deepen as Revenue Collapses 72% YoY
Explicit Finance Ltd., a micro-cap non-banking financial company, reported a concerning fourth quarter for FY26, with the company slipping into losses of ₹0.15 crores compared to a loss of ₹0.03 crores in the same quarter last year. The quarter was marked by a dramatic 71.61% year-on-year revenue decline and negative operating margins, raising serious questions about the sustainability of the company's business model.
Read full news article Announcements
Compliances-Certificate under Reg. 74 (5) of SEBI (DP) Regulations 2018
15-Jul-2026 | Source : BSEDear Sir/Madam Enclosed herewith is declaration under regulation 74(5) of SEBI(DP) Regulations 2018 for the quarter ended June 30 2026.
Closure of Trading Window
25-Jun-2026 | Source : BSEDear Sir/Madam Enclosed herewith is intimation of closure of trading window for the quarter ended June 30 2026.
Board Meeting Outcome for Outcome Of Board Meeting
16-Jun-2026 | Source : BSEOutcome of Board Meeting
Corporate Actions

No Upcoming Board Meetings

No Dividend history available

No Splits history available

No Bonus history available

No Rights history available
Quality key factors
Valuation key factors
Technicals key factors
 Technical Indicator Scale: Bearish, Mildly Bearish, Sideways, Mildly Bullish, Bullish Turned
 Shareholding Snapshot : Jun 2026
Shareholding Compare (%holding)
Non Institution
None
Held by 0 Schemes
Held by 0 FIIs
Trunadhanya Trading Private Limited (10.2%)
Angelica Trading Private Limited (14.84%)
31.5%
Quarterly Results Snapshot (Standalone) - Mar'26 - QoQ

QoQ Growth in quarter ended Mar 2026 is -24.72% vs 8.54% in Dec 2025
QoQ Growth in quarter ended Mar 2026 is -200.00% vs 236.36% in Dec 2025
Half Yearly Results Snapshot (Standalone) - Sep'25
Growth in half year ended Sep 2025 is -46.23% vs 2.58% in Sep 2024

Growth in half year ended Sep 2025 is 83.33% vs 64.71% in Sep 2024
Nine Monthly Results Snapshot (Standalone) - Dec'25
YoY Growth in nine months ended Dec 2025 is -41.04% vs -31.94% in Dec 2024
YoY Growth in nine months ended Dec 2025 is 600.00% vs -89.47% in Dec 2024
Annual Results Snapshot (Standalone) - Mar'26
YoY Growth in year ended Mar 2026 is -51.70% vs -27.98% in Mar 2025
YoY Growth in year ended Mar 2026 is 0.00% vs -100.00% in Mar 2025
About Explicit Finance Ltd

Company Coordinates


