
Compare Exxaro Tiles with Similar Stocks
Dashboard
Weak Long Term Fundamental Strength with a -0.69% CAGR growth in Operating Profits over the last 5 years
- Company's ability to service its debt is weak with a poor EBIT to Interest (avg) ratio of 1.28
- The company has been able to generate a Return on Equity (avg) of 1.23% signifying low profitability per unit of shareholders funds
Negative results in Mar 26
Below par performance in long term as well as near term
Stock DNA
Diversified consumer products
INR 295 Cr (Micro Cap)
101.00
30
0.00%
0.31
1.02%
1.05
Total Returns (Price + Dividend) 
Exxaro Tiles for the last several years.
Risk Adjusted Returns v/s
Returns Beta

News
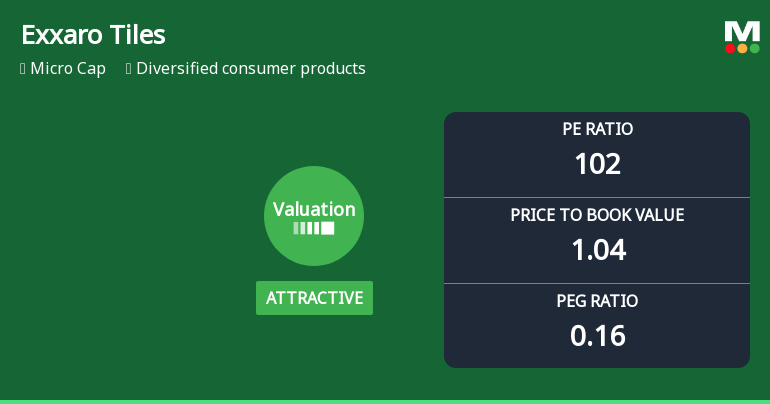
Exxaro Tiles Ltd Valuation Shifts Signal Mixed Prospects Amid Market Pressure
Exxaro Tiles Ltd, a micro-cap player in the diversified consumer products sector, has seen a notable shift in its valuation parameters, moving from a very attractive to an attractive price level. Despite this improvement in valuation metrics, the company continues to face headwinds with returns significantly lagging behind benchmark indices such as the Sensex. This article analyses the recent changes in Exxaro Tiles’ price-to-earnings (P/E) and price-to-book value (P/BV) ratios, compares them with peer averages, and assesses the implications for investors.
Read full news article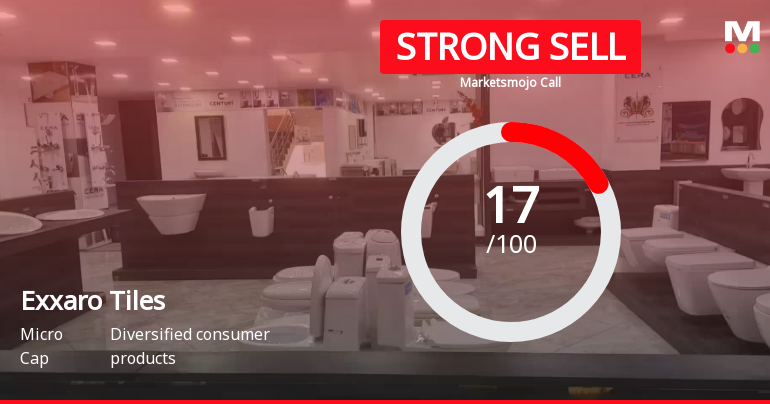
Exxaro Tiles Ltd is Rated Strong Sell
Exxaro Tiles Ltd is rated Strong Sell by MarketsMOJO, with this rating last updated on 05 May 2026. However, the analysis and financial metrics discussed here reflect the stock’s current position as of 04 June 2026, providing investors with the most up-to-date view of the company’s fundamentals, returns, and market performance.
Read full news article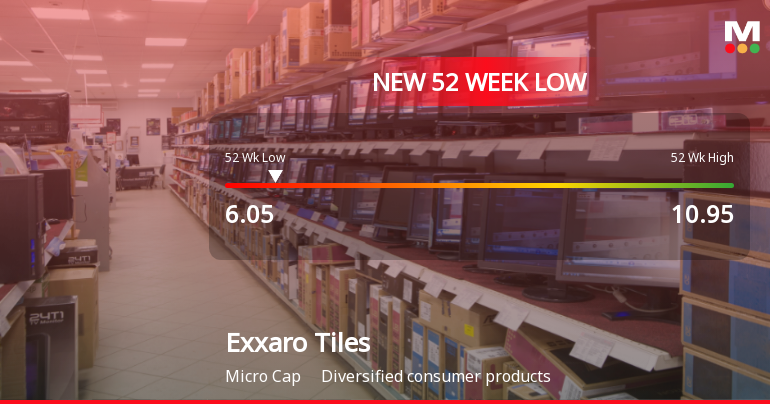
Announcements
Announcement under Regulation 30 (LODR)-Newspaper Publication
06-May-2026 | Source : BSENewspaper Publication for the Financial result for the 31.03.2026
Financial Result As On 31.03.26
05-May-2026 | Source : BSEFinancial result as on 31.03.26
Notice Of Opening Of Trading Window
05-May-2026 | Source : BSENotice of opening of Trading Window
Corporate Actions

No Upcoming Board Meetings

No Dividend history available

Exxaro Tiles Ltd has announced 1:10 stock split, ex-date: 13 Dec 24

No Bonus history available

No Rights history available
Quality key factors
Valuation key factors
Technicals key factors
 Technical Indicator Scale: Bearish, Mildly Bearish, Sideways, Mildly Bullish, Bullish Turned
 Shareholding Snapshot : Mar 2026
Shareholding Compare (%holding)
Non Institution
None
Held by 0 Schemes
Held by 3 FIIs (4.02%)
Dineshbhai Ramanlal Patel (16.88%)
Deep Diamond India Ltd (8.82%)
40.23%
Quarterly Results Snapshot (Consolidated) - Mar'26 - QoQ

QoQ Growth in quarter ended Mar 2026 is 40.49% vs 3.12% in Dec 2025

QoQ Growth in quarter ended Mar 2026 is -68.25% vs -47.50% in Dec 2025
Half Yearly Results Snapshot (Consolidated) - Sep'25
Growth in half year ended Sep 2025 is 3.15% vs -17.15% in Sep 2024
Growth in half year ended Sep 2025 is 141.36% vs -1,378.95% in Sep 2024
Nine Monthly Results Snapshot (Consolidated) - Dec'25
YoY Growth in nine months ended Dec 2025 is -2.03% vs -5.71% in Dec 2024
YoY Growth in nine months ended Dec 2025 is 172.93% vs -444.76% in Dec 2024
Annual Results Snapshot (Consolidated) - Mar'26
YoY Growth in year ended Mar 2026 is 0.23% vs 0.84% in Mar 2025
YoY Growth in year ended Mar 2026 is 2,458.33% vs -105.33% in Mar 2025
About Exxaro Tiles Ltd

Company Coordinates


