
Compare F A C T with Similar Stocks
Dashboard
Low ability to service debt as the company has a high Debt to EBITDA ratio of 57.59 times
- Low ability to service debt as the company has a high Debt to EBITDA ratio of 57.59 times
Poor long term growth as Operating profit has grown by an annual rate -42.43% of over the last 5 years
Flat results in Mar 26
With ROCE of 2.3, it has a Very Expensive valuation with a 19.9 Enterprise value to Capital Employed
Despite the size of the company, domestic mutual funds hold only 0.54% of the company
Underperformed the market in the last 1 year
Stock DNA
Fertilizers
INR 57,784 Cr (Mid Cap)
3,906.00
24
0.02%
1.17
1.08%
42.06
Total Returns (Price + Dividend) 
Latest dividend: 0.2010264667404649 per share ex-dividend date: Sep-19-2025
Risk Adjusted Returns v/s
Returns Beta

News

Fertilizers & Chemicals Travancore Ltd Sees Bullish Technical Momentum Amid Mixed Indicator Signals
Fertilizers & Chemicals Travancore Ltd (FACT) has demonstrated a notable shift in technical momentum, moving from a mildly bullish stance to a more confident bullish trend. This change is underpinned by a combination of positive signals from key technical indicators such as MACD, moving averages, and Bollinger Bands, signalling potential upside for investors despite some mixed readings from momentum oscillators like RSI.
Read full news article
Fertilizers & Chemicals Travancore Ltd is Rated Hold
Fertilizers & Chemicals Travancore Ltd is rated 'Hold' by MarketsMOJO, with this rating last updated on 10 June 2026. However, the analysis and financial metrics discussed here reflect the stock's current position as of 22 June 2026, providing investors with an up-to-date view of the company’s fundamentals, returns, and market standing.
Read full news article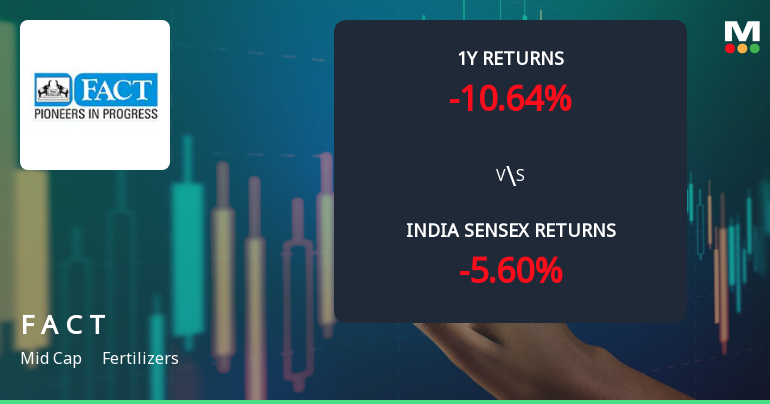
Fertilizers & Chemicals Travancore Ltd Sees Mixed Technical Signals Amid Price Momentum Shift
Fertilizers & Chemicals Travancore Ltd (FACT) has experienced a notable shift in its technical momentum, moving from a bullish to a mildly bullish trend as of mid-June 2026. This transition is underscored by mixed signals from key technical indicators such as MACD, RSI, Bollinger Bands, and moving averages, reflecting a nuanced market sentiment for the mid-cap fertilizer company amid recent price volatility.
Read full news article Announcements
Fertilizers and Chemicals Travancore Limited - Clarification - Financial Results
26-Nov-2019 | Source : NSEFertilizers and Chemicals Travancore Limited Chemicals Travancore Limited for the quarter ended 30-Sep-2019 with respect to Regulation 33 of the SEBI (Listing Obligations and Disclosure Requirements) Regulations, 2015.
Updates
21-Sep-2019 | Source : NSE
| Fertilizers and Chemicals Travancore Limited has informed the Exchange regarding 'The Board accorded approval for implementation of CAPEX project to the extend of Rs 700 crore (maximum), by utilising the proceeds from proposed land monetisation to Government of Kerala . '. |
Shareholders meeting
21-Sep-2019 | Source : NSE
| Fertilizers and Chemicals Travancore Limited has informed the Exchange regarding Proceedings of Annual General Meeting held on September 20, 2019. Further, the company has submitted the Exchange a copy of Srutinizers report along with voting results. |
Corporate Actions

No Upcoming Board Meetings

Fertilizers & Chemicals Travancore Ltd has declared 2% dividend, ex-date: 19 Sep 25

No Splits history available

No Bonus history available

No Rights history available
Quality key factors
Valuation key factors
Technicals key factors
 Technical Indicator Scale: Bearish, Mildly Bearish, Sideways, Mildly Bullish, Bullish Turned
 Shareholding Snapshot : Mar 2026
Shareholding Compare (%holding)
Promoters
None
Held by 38 Schemes (0.05%)
Held by 29 FIIs (0.21%)
The President Of India (90.0%)
Special National Investment Fund (8.56%)
0.71%
Quarterly Results Snapshot (Standalone) - Mar'26 - QoQ

QoQ Growth in quarter ended Mar 2026 is -5.36% vs -3.77% in Dec 2025

QoQ Growth in quarter ended Mar 2026 is 104.65% vs -425.50% in Dec 2025
Half Yearly Results Snapshot (Consolidated) - Sep'25
Growth in half year ended Sep 2025 is 30.46% vs -29.27% in Sep 2024
Growth in half year ended Sep 2025 is 167.06% vs -121.17% in Sep 2024
Nine Monthly Results Snapshot (Consolidated) - Dec'25
YoY Growth in nine months ended Dec 2025 is 41.44% vs -24.93% in Dec 2024
YoY Growth in nine months ended Dec 2025 is -45.00% vs -114.22% in Dec 2024
Annual Results Snapshot (Standalone) - Mar'26
YoY Growth in year ended Mar 2026 is 41.30% vs -19.80% in Mar 2025
YoY Growth in year ended Mar 2026 is -196.05% vs -67.86% in Mar 2025
About Fertilizers & Chemicals Travancore Ltd

Company Coordinates


