
Compare F5, Inc. with Similar Stocks
Total Returns (Price + Dividend) 
TimePeriod
Price Return
Dividend Return
Total Return
3 Months
0.36%
0%
0.36%
6 Months
4.64%
0%
4.64%
1 Year
59.85%
0%
59.85%
2 Years
82.21%
0%
82.21%
3 Years
70.73%
0%
70.73%
4 Years
37.66%
0%
37.66%
5 Years
83.16%
0%
83.16%
F5, Inc. for the last several years.
Risk Adjusted Returns v/s
News
F5, Inc. Experiences Revision in Its Stock Evaluation Amid Strong Market Performance
F5, Inc. has recently adjusted its valuation, with a P/E ratio of 27 and an EV to EBITDA of 18.20, reflecting strong earnings performance. The company also reports a ROCE of 35.08% and a ROE of 19.07%. Year-to-date, F5 has outperformed the S&P 500 with a return of 19.66%.
Read full news article Announcements

No announcement available
Corporate Actions
No corporate action available
Quality key factors
Factor
Value
Sales Growth (5y)
5.39%
EBIT Growth (5y)
12.12%
EBIT to Interest (avg)
100.00
Debt to EBITDA (avg)
0
Net Debt to Equity (avg)
-0.37
Sales to Capital Employed (avg)
0.94
Tax Ratio
17.74%
Dividend Payout Ratio
0
Pledged Shares
0
Institutional Holding
100.00%
ROCE (avg)
26.35%
ROE (avg)
16.17%
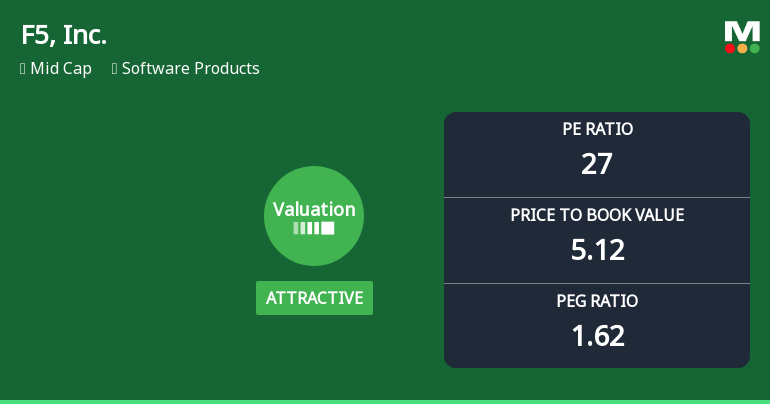
Valuation key factors
Factor
Value
P/E Ratio
27
Industry P/E
Price to Book Value
5.12
EV to EBIT
21.52
EV to EBITDA
18.20
EV to Capital Employed
7.55
EV to Sales
5.35
PEG Ratio
1.62
Dividend Yield
NA
ROCE (Latest)
35.08%
ROE (Latest)
19.07%
Technicals key factors
Indicator
Weekly
Monthly
MACD
Bearish
Mildly Bearish
RSI
Bullish
No Signal
Bollinger Bands
Bearish
Sideways
Moving Averages
Mildly Bearish (Daily)
KST
Bearish
Mildly Bearish
Dow Theory
Mildly Bullish
Mildly Bearish
OBV
No Trend
Mildly Bearish
 Technical Indicator Scale: Bearish, Mildly Bearish, Sideways, Mildly Bullish, Bullish Turned
 Shareholding Snapshot : Mar 2025
Shareholding Compare (%holding)
Majority shareholders
Domestic Funds
Domestic Funds
Held in 136 Schemes (45.91%)
Foreign Institutions
Held by 343 Foreign Institutions (23.81%)
Strategic Entities with highest holding
Highest Public shareholder
Quarterly Results Snapshot (Consolidated) - Jun'25 - YoY
Jun'25
Jun'24
Change(%)
Net Sales
780.40
695.50
12.21%
Operating Profit (PBDIT) excl Other Income
228.40
198.70
14.95%
Interest
0.00
0.00
Exceptional Items
0.00
-0.10
100.00%
Consolidate Net Profit
189.90
144.10
31.78%
Operating Profit Margin (Excl OI)
251.60%
234.60%
1.70%
USD in Million.

Net Sales
YoY Growth in quarter ended Jun 2025 is 12.21% vs -1.01% in Jun 2024

Consolidated Net Profit
YoY Growth in quarter ended Jun 2025 is 31.78% vs 61.91% in Jun 2024
Annual Results Snapshot (Consolidated) - Sep'24
Sep'24
Sep'23
Change(%)
Net Sales
2,816.10
2,813.20
0.10%
Operating Profit (PBDIT) excl Other Income
809.60
688.40
17.61%
Interest
0.00
0.00
Exceptional Items
-8.70
-65.40
86.70%
Consolidate Net Profit
566.80
394.90
43.53%
Operating Profit Margin (Excl OI)
236.90%
191.20%
4.57%
USD in Million.
Net Sales
YoY Growth in year ended Sep 2024 is 0.10% vs 4.35% in Sep 2023
Consolidated Net Profit
YoY Growth in year ended Sep 2024 is 43.53% vs 22.56% in Sep 2023
About F5, Inc.

F5, Inc.
Software Products
F5 Networks, Inc. is a developer and provider of software defined application services. The Company is engaged in the development, marketing and sale of application delivery networking products that optimize the security, performance and availability of network applications, servers and storage systems. The Company's geographical segments include the Americas (primarily the United States); Europe, the Middle East, and Africa (EMEA); Japan, and the Asia Pacific region (APAC). The Company's Traffic Management Operating System (TMOS) based offerings include software products for local and global traffic management, network and application security, access management, Web acceleration and various network and application services. These products are available as modules that can run individually or as part of an integrated solution on the Company's purpose-built BIG-IP appliances and VIPRION chassis-based hardware, or as software-only Virtual Editions.
Company Coordinates
Company Details
401 Elliott Ave W , SEATTLE WA : 98119-4017


Registrar Details
InfinHub Market Technologies FZ-LLC, Building-2, Unit 112, Dubai Internet City, Dubai, United Arab Emirates
GET THE MARKETSMOJO APP


Company
Stocks
Portfolio


"Investment in securities markets are subject to market risk. Read all the related documents carefully before investing."