
Compare Fabtech Tech. with Similar Stocks
Dashboard
The company is Net-Debt Free
- PBT LESS OI(Q) At Rs 20.18 cr has Grown at 255.0% (vs previous 4Q average)
- PAT(9M) Higher at Rs 44.49 Cr
- NET SALES(Q) Highest at Rs 158.52 cr
With ROE of 13.1, it has a Attractive valuation with a 3.8 Price to Book Value
Despite the size of the company, domestic mutual funds hold only 0% of the company
Stock DNA
Industrial Manufacturing
INR 642 Cr (Micro Cap)
18.00
37
0.00%
0.02
13.08%
3.77
Total Returns (Price + Dividend) 
Fabtech Tech. for the last several years.
Risk Adjusted Returns v/s
Returns Beta

News
Fabtech Technologies Ltd is Rated Hold by MarketsMOJO
Fabtech Technologies Ltd is rated 'Hold' by MarketsMOJO, with this rating last updated on 18 May 2026. While the rating change occurred on that date, the analysis and financial metrics discussed here reflect the company’s current position as of 10 June 2026, providing investors with the most up-to-date view of the stock’s fundamentals, valuation, financial trends, and technical outlook.
Read full news article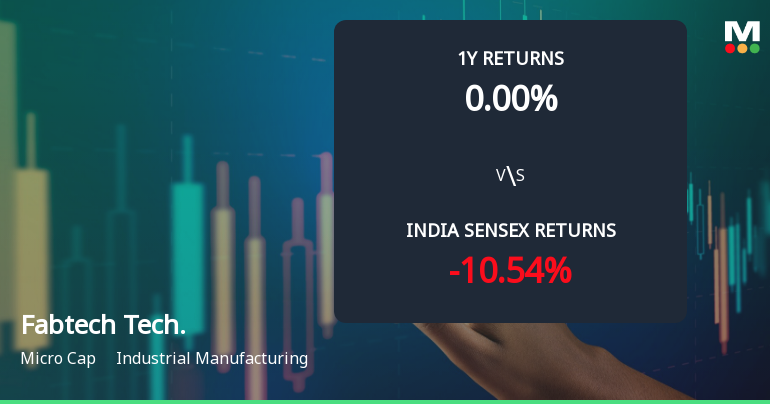
Fabtech Technologies Ltd Technical Momentum Shifts to Mildly Bullish Amid Market Challenges
Fabtech Technologies Ltd, a micro-cap player in the industrial manufacturing sector, has recently exhibited a subtle but noteworthy shift in its technical momentum. After a prolonged sideways trend, key indicators now suggest a mildly bullish outlook, although the stock continues to face headwinds from broader market pressures and its own valuation challenges.
Read full news article
Fabtech Technologies Ltd Technical Momentum Shifts Amid Market Challenges
Fabtech Technologies Ltd, a micro-cap player in the industrial manufacturing sector, has experienced a notable shift in its technical momentum, moving from a mildly bullish stance to a sideways trend. This change is reflected in key technical indicators such as MACD, RSI, and Bollinger Bands, signalling a period of consolidation after recent volatility. Investors should carefully analyse these developments in the context of the company’s recent price performance and broader market trends.
Read full news article Announcements
Acqusition Of To Be Incorporated Company
02-Jun-2026 | Source : BSEFabtech Technologies Limited has informed the Exchange about Acquisition of to be incorporated Company
Announcement under Regulation 30 (LODR)-Newspaper Publication
30-May-2026 | Source : BSEFabtech Technologies Limited has informed the Exchange about Copy of Newspaper Publication for the dispatch of Postal Ballot Notice.
Shareholder Meeting / Postal Ballot-Notice of Postal Ballot
29-May-2026 | Source : BSEIntimation of Postal Ballot Notice
Corporate Actions

No Upcoming Board Meetings

No Dividend history available

No Splits history available

No Bonus history available

No Rights history available
Quality key factors
Valuation key factors
Technicals key factors
 Technical Indicator Scale: Bearish, Mildly Bearish, Sideways, Mildly Bullish, Bullish Turned
 Shareholding Snapshot : Mar 2026
Shareholding Compare (%holding)
Promoters
None
Held by 2 Schemes (0.0%)
Held by 4 FIIs (0.08%)
Aasif Ahsan Khan (41.52%)
Keya Vimal Salot (1.75%)
21.71%
Quarterly Results Snapshot (Standalone) - Dec'25 - QoQ

QoQ Growth in quarter ended Dec 2025 is -41.47% vs 25.36% in Sep 2025
QoQ Growth in quarter ended Dec 2025 is -93.03% vs 253.39% in Sep 2025
Half Yearly Results Snapshot (Standalone) - Sep'25
Not Applicable: The company has declared_date for only one period
Not Applicable: The company has declared_date for only one period
Nine Monthly Results Snapshot (Standalone) - Dec'25
Not Applicable: The company has declared_date for only one period
Not Applicable: The company has declared_date for only one period
Annual Results Snapshot (Standalone) - Mar'25

YoY Growth in year ended Mar 2025 is 21.99% vs -24.64% in Mar 2023
YoY Growth in year ended Mar 2025 is 104.91% vs -17.23% in Mar 2023
About Fabtech Technologies Ltd

Company Coordinates


