
Compare Facor Alloys with Similar Stocks
Dashboard
With a Operating Losses, the company has a Weak Long Term Fundamental Strength
- Company's ability to service its debt is weak with a poor EBIT to Interest (avg) ratio of -3.77
- The company has been able to generate a Return on Equity (avg) of 4.57% signifying low profitability per unit of shareholders funds
Flat results in Mar 26
Risky - Negative EBITDA
70.91% of Promoter Shares are Pledged
Stock DNA
Ferrous Metals
INR 69 Cr (Micro Cap)
NA (Loss Making)
12
0.00%
0.05
-19.57%
0.72
Total Returns (Price + Dividend) 
Latest dividend: 0.2000 per share ex-dividend date: Aug-30-2011
Risk Adjusted Returns v/s
Returns Beta

News

Facor Alloys Ltd is Rated Sell
Facor Alloys Ltd is rated Sell by MarketsMOJO. This rating was last updated on 16 June 2026, reflecting a shift from a previous Strong Sell grade. However, the analysis and financial metrics discussed here represent the stock’s current position as of 29 June 2026, providing investors with the latest insights into the company’s performance and outlook.
Read full news article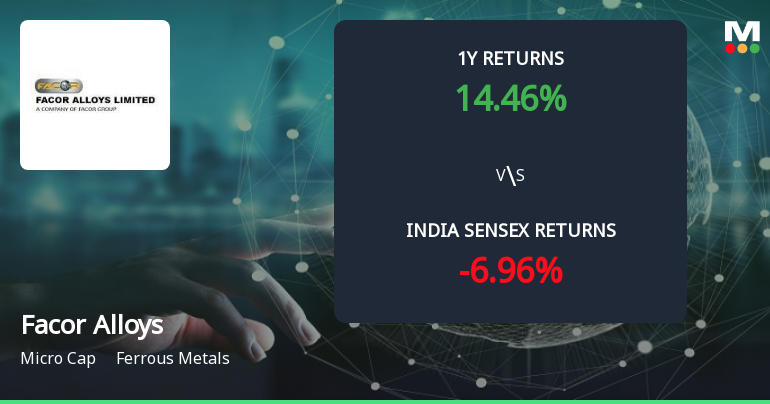
Golden Cross Forms in Facor Alloys Ltd Amid Mixed Technical Signals and Strong Recent Rally
The 50-day moving average has crossed above the 200-day moving average for Facor Alloys Ltd on 23 Jun 2026, signalling a golden cross. Yet, the broader technical indicators and fundamental backdrop present a nuanced picture that tempers the enthusiasm this crossover might otherwise generate.
Read full news article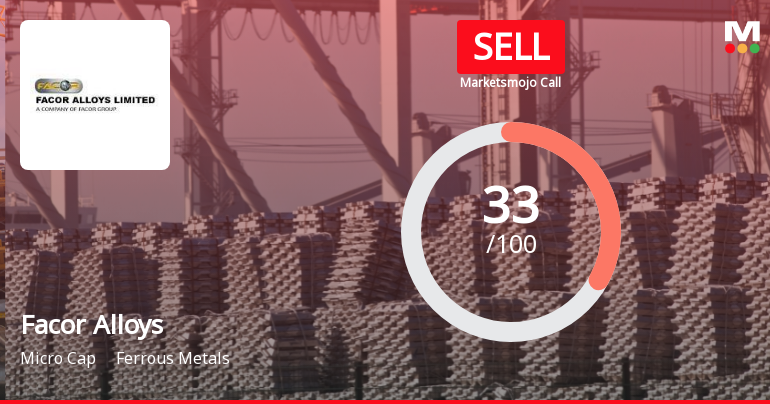
Facor Alloys Ltd Upgraded to Sell on Technical Improvements Despite Weak Fundamentals
Facor Alloys Ltd, a micro-cap player in the ferrous metals sector, has seen its investment rating upgraded from Strong Sell to Sell as of 16 June 2026. This change reflects a nuanced shift in the company’s technical outlook despite persistent fundamental challenges. The upgrade is primarily driven by improvements in technical indicators, while valuation and financial trends remain subdued, underscoring a cautious stance for investors.
Read full news article Announcements
Closure of Trading Window
25-Jun-2026 | Source : BSEClosure of Trading Window
Shareholder Meeting / Postal Ballot-Notice of Postal Ballot
17-Jun-2026 | Source : BSENotice of Postal Ballot
Statement Of Audit Qualification On The Consolidated Financial Results For The Quarter And Year Ended 31St March 2026
12-Jun-2026 | Source : BSEStatement of Audit Qualification on the Consolidated Financial Results for the Quarter and Year Ended 31st March 2026
Corporate Actions

No Upcoming Board Meetings

Facor Alloys Ltd has declared 20% dividend, ex-date: 30 Aug 11

No Splits history available

No Bonus history available

No Rights history available
Quality key factors
Valuation key factors
Technicals key factors
 Technical Indicator Scale: Bearish, Mildly Bearish, Sideways, Mildly Bullish, Bullish Turned
 Shareholding Snapshot : Mar 2026
Shareholding Compare (%holding)
Non Institution
70.9053
Held by 2 Schemes (0.0%)
Held by 0 FIIs
Ms R B Shreeram And Co Private Limited (31.22%)
Globalscale Investments Limited (2.3%)
50.67%
Quarterly Results Snapshot (Consolidated) - Mar'26 - QoQ

QoQ Growth in quarter ended Mar 2026 is -51.85% vs -73.53% in Dec 2025
QoQ Growth in quarter ended Mar 2026 is 51.95% vs -19.07% in Dec 2025
Half Yearly Results Snapshot (Consolidated) - Sep'25
Growth in half year ended Sep 2025 is 0.00% vs -100.00% in Sep 2024
Growth in half year ended Sep 2025 is 57.97% vs -132.63% in Sep 2024
Nine Monthly Results Snapshot (Consolidated) - Dec'25
YoY Growth in nine months ended Dec 2025 is 0.00% vs -100.00% in Dec 2024
YoY Growth in nine months ended Dec 2025 is 75.06% vs -238.56% in Dec 2024
Annual Results Snapshot (Consolidated) - Mar'26

YoY Growth in year ended Mar 2026 is -99.04% vs 0.00% in Mar 2025
YoY Growth in year ended Mar 2026 is 25.67% vs 0.00% in Mar 2025
About Facor Alloys Ltd

Company Coordinates


