
Compare FCS Software with Similar Stocks
Stock DNA
Computers - Software & Consulting
INR 256 Cr (Micro Cap)
62.00
21
0.00%
-0.13
0.86%
0.62
Total Returns (Price + Dividend) 
Latest dividend: 0.024999999999999998 per share ex-dividend date: Sep-03-2009
Risk Adjusted Returns v/s
Returns Beta

News
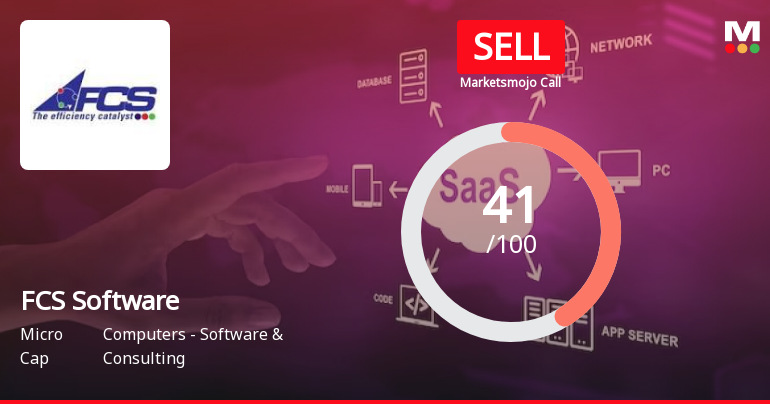
FCS Software Solutions Ltd is Rated Sell
FCS Software Solutions Ltd is rated Sell by MarketsMOJO, with this rating last updated on 25 July 2026. While the rating change occurred on that date, the analysis and financial metrics discussed here reflect the stock’s current position as of 30 July 2026, providing investors with the most up-to-date view of the company’s fundamentals, returns, and market performance.
Read full news article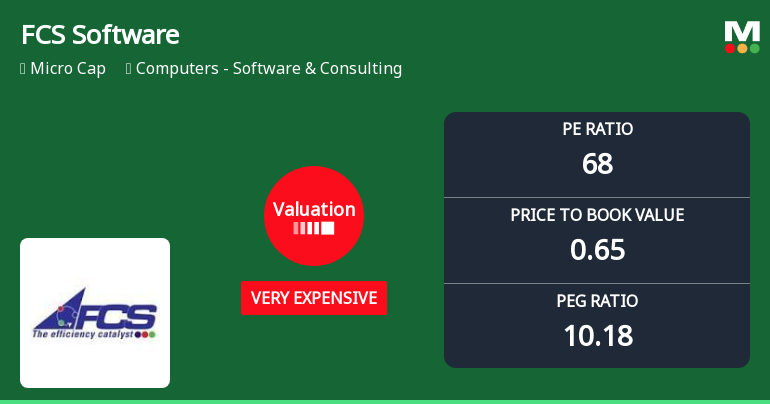
FCS Software Solutions Ltd Valuation Shifts Signal Heightened Price Risk
FCS Software Solutions Ltd has seen a marked shift in its valuation parameters, moving from an expensive to a very expensive rating, driven primarily by its elevated price-to-earnings (P/E) ratio and other key multiples. This article analyses the recent valuation changes, compares the company’s metrics with its industry peers, and examines the implications for investors amid broader market trends.
Read full news articleAre FCS Software Solutions Ltd latest results good or bad?
FCS Software Solutions Ltd's latest financial results for Q1 FY27 reveal a complex picture of operational performance. The company reported net sales of ₹16.12 crores, reflecting a significant year-on-year growth of 82.97% compared to ₹8.81 crores in Q1 FY26. However, this growth was accompanied by a notable quarter-on-quarter decline of 39.78% from the previous quarter's revenue of ₹26.77 crores. In terms of profitability, FCS Software's net profit stood at ₹0.63 crores, marking a remarkable year-on-year increase of 6,200% from a negligible profit in Q1 FY26. Despite this impressive growth in net profit, the company experienced an alarming quarter-on-quarter decline of 88.33% from ₹5.40 crores in Q4 FY26. This volatility raises concerns regarding the sustainability of earnings. The operating margin for the quarter fell to 6.45%, down from 21.74% in the previous quarter, indicating significant margin comp...
Read full news article Announcements
Notice Of 33Rd AGM Of The Company
29-Jul-2026 | Source : BSEPursuant to provision of SEBI (LODR) 2015 please find enclosed herewith Notice 33rd AGM of the Company scheduled to be held on Tuesday 25th Aug 2026 at 11:30 A.M. through VC/OAVM
Notice Of 33Rd Annual General Meeting Of The Company
29-Jul-2026 | Source : BSEPursuant to the provisions of SEBI (LODR) 2015 please find enclosed herewith Notice of 33rd AGM of the Company to be held on Tuesday 25th August 2026 at 11:30 A.M. through VC/OAVM
Announcement under Regulation 30 (LODR)-Newspaper Publication
27-Jul-2026 | Source : BSEIntimation of Newspaper Publication of 229th Board Meeting held on 25th July 2026
Corporate Actions

No Upcoming Board Meetings

FCS Software Solutions Ltd has declared 5% dividend, ex-date: 03 Sep 09

FCS Software Solutions Ltd has announced 1:10 stock split, ex-date: 15 Oct 09

FCS Software Solutions Ltd has announced 1:1 bonus issue, ex-date: 26 Feb 10

No Rights history available
Quality key factors
Valuation key factors
Technicals key factors
 Technical Indicator Scale: Bearish, Mildly Bearish, Sideways, Mildly Bullish, Bullish Turned
 Shareholding Snapshot : Jun 2026
Shareholding Compare (%holding)
Non Institution
None
Held by 0 Schemes
Held by 3 FIIs (0.01%)
Dalip Kumar (10.88%)
Slg Softech Private Limited (6.27%)
65.92%
Quarterly Results Snapshot (Consolidated) - Jun'26 - YoY

YoY Growth in quarter ended Jun 2026 is 82.97% vs -4.03% in Jun 2025
YoY Growth in quarter ended Jun 2026 is 6,200.00% vs -99.26% in Jun 2025
Half Yearly Results Snapshot (Consolidated) - Sep'25

Growth in half year ended Sep 2025 is -10.61% vs 3.24% in Sep 2024
Growth in half year ended Sep 2025 is -132.93% vs 149.60% in Sep 2024
Nine Monthly Results Snapshot (Consolidated) - Dec'25
YoY Growth in nine months ended Dec 2025 is 13.16% vs 2.82% in Dec 2024
YoY Growth in nine months ended Dec 2025 is -174.73% vs 139.03% in Dec 2024
Annual Results Snapshot (Consolidated) - Mar'26
YoY Growth in year ended Mar 2026 is 59.14% vs -0.08% in Mar 2025
YoY Growth in year ended Mar 2026 is -29.76% vs 130.95% in Mar 2025
About FCS Software Solutions Ltd

Company Coordinates


