
Compare FCS Software with Similar Stocks
Dashboard
Company has a Debt to Equity ratio (avg) of 0.02 times
Poor long term growth as Net Sales has grown by an annual rate of 11.29% and Operating profit at 8.01% over the last 5 years
With a growth in Net Profit of 53900%, the company declared Outstanding results in Mar 26
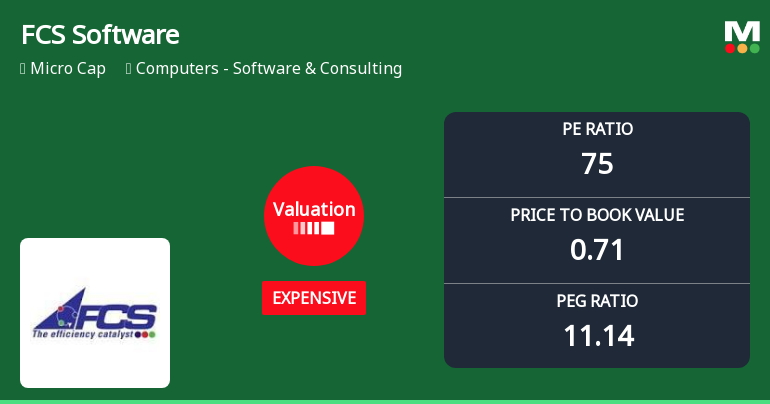
With ROE of 1, it has a Expensive valuation with a 0.7 Price to Book Value
Majority shareholders : Non Institution
Underperformed the market in the last 1 year
Stock DNA
Computers - Software & Consulting
INR 292 Cr (Micro Cap)
72.00
20
0.00%
-0.13
0.96%
0.70
Total Returns (Price + Dividend) 
Latest dividend: 0.5 per share ex-dividend date: Sep-03-2009
Risk Adjusted Returns v/s
Returns Beta

News
FCS Software Solutions Ltd Valuation Shifts Signal Mixed Investor Sentiment
FCS Software Solutions Ltd has experienced a notable shift in its valuation parameters, moving from a very expensive to an expensive rating, reflecting a nuanced change in price attractiveness. Despite a modest recent decline in share price, the company’s elevated price-to-earnings (P/E) and price-to-book value (P/BV) ratios relative to peers and historical averages warrant a closer examination for investors seeking clarity on its market positioning.
Read full news article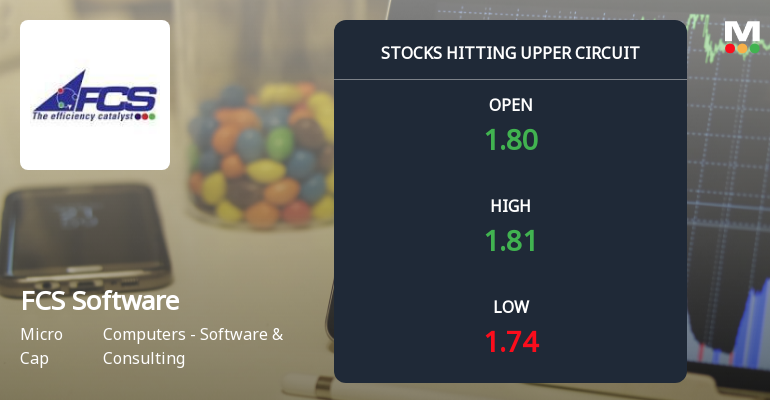
FCS Software Solutions Ltd Locks at Upper Circuit With 4.65% Gain — Buyers Queue, Sellers Absent
At Rs 1.80, the buying was done — not because demand dried up, but because the exchange wouldn't let the stock go any higher. FCS Software Solutions Ltd locked at its upper circuit of 4.65% on 3 Jun 2026, with buyers queuing and no sellers willing to part with shares.
Read full news article
FCS Software Solutions Ltd Locks at Upper Circuit With 4.88% Gain — Buyers Queue, Sellers Absent
At Rs 1.72, the buying was done — not because demand dried up, but because the exchange wouldn't let the stock go any higher. FCS Software Solutions Ltd locked at its upper circuit of 4.88% on 2 Jun 2026, with buyers queuing and no sellers willing to part with shares.
Read full news article Announcements
Announcement under Regulation 30 (LODR)-Newspaper Publication
29-May-2026 | Source : BSEIntimation of Newspaper Advertisement of 228th Board Meeting held on 28th May 2026 with reference to Regulation 47 of SEBI (LODR) Regulations 2015
Outcome Of The 228Th Meeting Of The Board Of Directors Of The Company Held On Thursday 28Th May 2026 For Audited Financial Results (Standalone And Consolidated) Of The Company For The Quarter Ended On 31Th March 2026 As Per IND-AS Rules Of Company (Indian
28-May-2026 | Source : BSEAudited Financial results for the quarter and year ended as on 31st March 2026
Board Meeting Outcome for Outcome Of The 228Th Meeting Of The Board Of Directors Of The Company Held On Thursday 28Th May 2026
28-May-2026 | Source : BSEBoard of Directors in its 228th Meeting held today i.e. Thursday 28th May 2026 at Corporate Office at FCS House Plot No. 83 NSEZ Noida Dadri Road Phase II Gautam Buddha Nagar Noida- 201305 (U.P.) considered and approved the Audited Financial Results (Standalone and Consolidated) of the Company for the quarter ended on 31th March 2026 as per IND-AS Rules of Company (Indian Accounting Standard) Rules 2015.
Corporate Actions

No Upcoming Board Meetings

FCS Software Solutions Ltd has declared 5% dividend, ex-date: 03 Sep 09

FCS Software Solutions Ltd has announced 1:10 stock split, ex-date: 15 Oct 09

FCS Software Solutions Ltd has announced 1:1 bonus issue, ex-date: 26 Feb 10

No Rights history available
Quality key factors
Valuation key factors
Technicals key factors
 Technical Indicator Scale: Bearish, Mildly Bearish, Sideways, Mildly Bullish, Bullish Turned
 Shareholding Snapshot : Mar 2026
Shareholding Compare (%holding)
Non Institution
None
Held by 0 Schemes
Held by 3 FIIs (0.01%)
Dalip Kumar (10.88%)
Slg Softech Private Limited (6.27%)
65.96%
Quarterly Results Snapshot (Consolidated) - Mar'26 - YoY

YoY Growth in quarter ended Mar 2026 is 203.86% vs -8.23% in Mar 2025
YoY Growth in quarter ended Mar 2026 is 53,900.00% vs 100.88% in Mar 2025
Half Yearly Results Snapshot (Consolidated) - Sep'25

Growth in half year ended Sep 2025 is -10.61% vs 3.24% in Sep 2024
Growth in half year ended Sep 2025 is -132.93% vs 149.60% in Sep 2024
Nine Monthly Results Snapshot (Consolidated) - Dec'25
YoY Growth in nine months ended Dec 2025 is 13.16% vs 2.82% in Dec 2024
YoY Growth in nine months ended Dec 2025 is -174.73% vs 139.03% in Dec 2024
Annual Results Snapshot (Consolidated) - Mar'26
YoY Growth in year ended Mar 2026 is 59.14% vs -0.08% in Mar 2025
YoY Growth in year ended Mar 2026 is -29.76% vs 130.95% in Mar 2025
About FCS Software Solutions Ltd

Company Coordinates


