
Compare Fedbank Financi. with Similar Stocks
Dashboard
Strong Long Term Fundamental Strength with a 24.72% CAGR growth in Operating Profits
Healthy long term growth as Net Sales has grown by an annual rate of 25.32% and Operating profit at 24.72%
With a growth in Net Profit of 13.78%, the company declared Very Positive results in Jun 26
With ROE of 11.7, it has a Fair valuation with a 2 Price to Book Value
Majority shareholders : Promoters
Stock DNA
Non Banking Financial Company (NBFC)
INR 5,912 Cr (Small Cap)
17.00
21
0.00%
4.67
11.74%
1.98
Total Returns (Price + Dividend) 
Fedbank Financi. for the last several years.
Risk Adjusted Returns v/s
Returns Beta

News
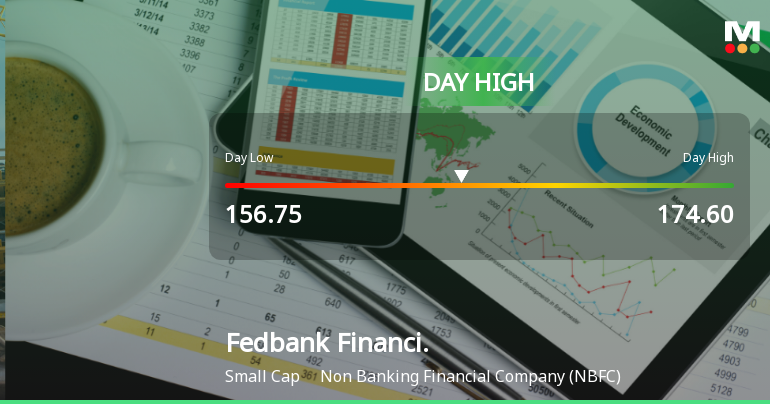
Fedbank Financial Services Ltd Surges 10.31% to Day's High of Rs 174.6 — Outperforms Sector by 10.18 Percentage Points
The Sensex advanced 0.66% on 15 Jul 2026, yet Fedbank Financial Services Ltd outpaced the broader market with a robust 10.31% gain, reaching an intraday high of Rs 174.6. This 10.18 percentage-point outperformance over its NBFC sector peers signals a distinctly stock-specific rally rather than a market-wide lift.
Read full news article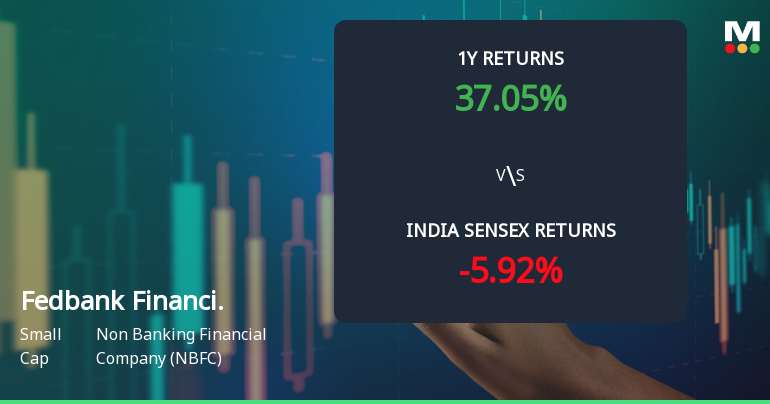
Fedbank Financial Services Ltd Technical Momentum Shifts to Bullish Amid Market Volatility
Fedbank Financial Services Ltd has witnessed a notable shift in its technical momentum, upgrading from a mildly bullish to a bullish stance. This change is underpinned by positive signals from key indicators such as the MACD and moving averages, signalling potential strength in the stock’s price trajectory despite a recent slight dip in daily price.
Read full news article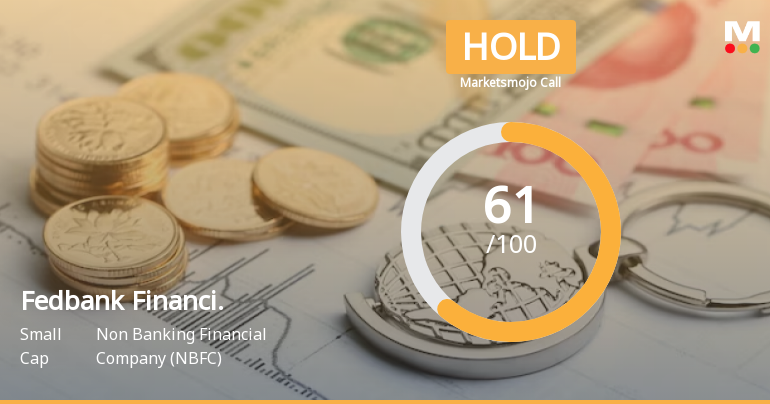
Fedbank Financial Services Ltd is Rated Hold
Fedbank Financial Services Ltd is rated 'Hold' by MarketsMOJO, with this rating last updated on 18 May 2026. However, the analysis and financial metrics discussed here reflect the stock's current position as of 13 July 2026, providing investors with an up-to-date view of its performance and outlook.
Read full news article Announcements
Announcement under Regulation 30 (LODR)-Allotment of ESOP / ESPS
10-Jul-2026 | Source : BSEIntimation of Allotment of 54650 Equity Shares due to exercise of vested stock options by the grantees
Announcement under Regulation 30 (LODR)-Analyst / Investor Meet - Intimation
10-Jul-2026 | Source : BSEIntimation of Earnings Call with Analyst/Investor to discuss the Financial Results of the Company for the quarter ended June 30 2026
Compliances-Certificate under Reg. 74 (5) of SEBI (DP) Regulations 2018
08-Jul-2026 | Source : BSEConfirmation certificate under Regulation 74 (5) of SEBI (DP) Regulations 2018
Corporate Actions

(15 Jul 2026)

No Dividend history available

No Splits history available

No Bonus history available

No Rights history available
Quality key factors
Valuation key factors
Technicals key factors
 Technical Indicator Scale: Bearish, Mildly Bearish, Sideways, Mildly Bullish, Bullish Turned
 Shareholding Snapshot : Mar 2026
Shareholding Compare (%holding)
Promoters
None
Held by 9 Schemes (2.71%)
Held by 30 FIIs (0.66%)
Financial Institutions / Banks (60.79%)
True North Fund Vi Llp (7.26%)
15.53%
Quarterly Results Snapshot (Standalone) - Jun'26 - QoQ

QoQ Growth in quarter ended Jun 2026 is 8.68% vs 11.04% in Mar 2026
QoQ Growth in quarter ended Jun 2026 is 13.78% vs 14.36% in Mar 2026
Half Yearly Results Snapshot (Standalone) - Sep'25
Growth in half year ended Sep 2025 is 6.23% vs 30.96% in Sep 2024
Growth in half year ended Sep 2025 is 15.12% vs 20.73% in Sep 2024
Nine Monthly Results Snapshot (Standalone) - Dec'25
YoY Growth in nine months ended Dec 2025 is 5.71% vs 29.98% in Dec 2024

YoY Growth in nine months ended Dec 2025 is 58.31% vs -13.27% in Dec 2024
Annual Results Snapshot (Standalone) - Mar'26
YoY Growth in year ended Mar 2026 is 7.84% vs 30.73% in Mar 2025
YoY Growth in year ended Mar 2026 is 52.59% vs -7.98% in Mar 2025
About Fedbank Financial Services Ltd

Company Coordinates


