
Compare Fedbank Financi. with Similar Stocks
Dashboard
Strong Long Term Fundamental Strength with a 24.72% CAGR growth in Operating Profits
Healthy long term growth as Net Sales has grown by an annual rate of 25.32% and Operating profit at 24.72%
The company has declared Positive results for the last 5 consecutive quarters
With ROE of 11.7, it has a Fair valuation with a 1.9 Price to Book Value
Majority shareholders : Promoters
Market Beating Performance
Stock DNA
Non Banking Financial Company (NBFC)
INR 5,615 Cr (Small Cap)
16.00
20
0.00%
4.67
11.74%
1.93
Total Returns (Price + Dividend) 
Fedbank Financi. for the last several years.
Risk Adjusted Returns v/s
Returns Beta

News

Fedbank Financial Services Ltd is Rated Hold
Fedbank Financial Services Ltd is rated 'Hold' by MarketsMOJO, with this rating last updated on 18 May 2026. However, the analysis and financial metrics presented here reflect the stock's current position as of 10 June 2026, providing investors with the latest insights into its performance and outlook.
Read full news article
Fedbank Financial Services Ltd Technical Momentum Shifts Amid Mixed Market Signals
Fedbank Financial Services Ltd, a small-cap player in the Non Banking Financial Company (NBFC) sector, has experienced a notable shift in its technical momentum, moving from a bullish to a mildly bullish stance. Despite a recent 5.02% decline in its share price to ₹153.20, the stock’s technical indicators present a nuanced picture, reflecting both positive and cautionary signals for investors navigating the current market environment.
Read full news article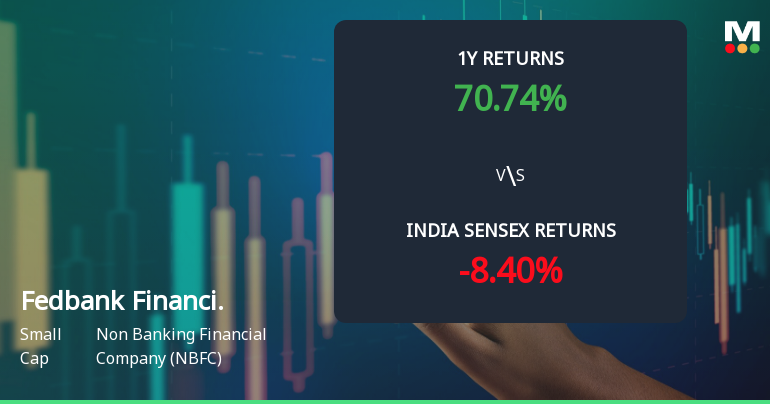
Fedbank Financial Services Ltd Technical Momentum Shifts to Bullish Amid Strong Returns
Fedbank Financial Services Ltd, a small-cap player in the Non Banking Financial Company (NBFC) sector, has recently exhibited a notable shift in its technical momentum, upgrading from a sideways trend to a bullish stance. This change is underscored by a series of positive signals from key technical indicators, suggesting renewed investor interest and potential upside in the stock’s price trajectory despite a marginal day-on-day decline.
Read full news article Announcements
Shareholder Meeting / Postal Ballot-Scrutinizers Report
10-Jun-2026 | Source : BSEPostal Ballot Result declaration along with the Scrutinizers Report
Announcement under Regulation 30 (LODR)-Allotment of ESOP / ESPS
04-Jun-2026 | Source : BSEIntimation of allotment of 188719 equity shares due to exercise of vested stock options by the grantees
Announcement under Regulation 30 (LODR)-Analyst / Investor Meet - Intimation
29-May-2026 | Source : BSEIntimation of the Investor Meeting to be held on June 09 2026
Corporate Actions

No Upcoming Board Meetings

No Dividend history available

No Splits history available

No Bonus history available

No Rights history available
Quality key factors
Valuation key factors
Technicals key factors
 Technical Indicator Scale: Bearish, Mildly Bearish, Sideways, Mildly Bullish, Bullish Turned
 Shareholding Snapshot : Mar 2026
Shareholding Compare (%holding)
Promoters
None
Held by 9 Schemes (2.71%)
Held by 30 FIIs (0.66%)
Financial Institutions / Banks (60.79%)
True North Fund Vi Llp (7.26%)
15.53%
Quarterly Results Snapshot (Standalone) - Mar'26 - QoQ

QoQ Growth in quarter ended Mar 2026 is 11.04% vs 3.70% in Dec 2025
QoQ Growth in quarter ended Mar 2026 is 14.36% vs 9.68% in Dec 2025
Half Yearly Results Snapshot (Standalone) - Sep'25

Growth in half year ended Sep 2025 is 6.23% vs 30.96% in Sep 2024
Growth in half year ended Sep 2025 is 15.12% vs 20.73% in Sep 2024
Nine Monthly Results Snapshot (Standalone) - Dec'25
YoY Growth in nine months ended Dec 2025 is 5.71% vs 29.98% in Dec 2024
YoY Growth in nine months ended Dec 2025 is 58.31% vs -13.27% in Dec 2024
Annual Results Snapshot (Standalone) - Mar'26
YoY Growth in year ended Mar 2026 is 7.84% vs 30.73% in Mar 2025
YoY Growth in year ended Mar 2026 is 52.59% vs -7.98% in Mar 2025
About Fedbank Financial Services Ltd

Company Coordinates


