
Compare Fedders Holding with Similar Stocks
Stock DNA
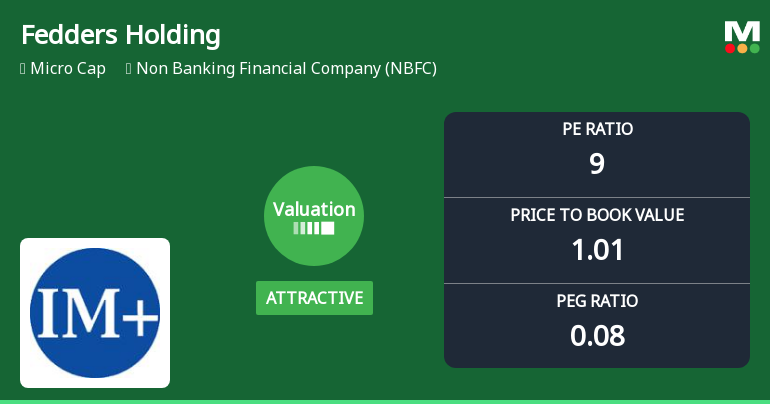
Non Banking Financial Company (NBFC)
INR 701 Cr (Micro Cap)
9.00
20
0.00%
0.09
10.99%
0.97
Total Returns (Price + Dividend) 
Latest dividend: 1 per share ex-dividend date: Sep-19-2013
Risk Adjusted Returns v/s
Returns Beta

News
Fedders Holding Ltd Valuation Shifts Signal Renewed Price Attractiveness Amid Mixed Returns
Fedders Holding Ltd, a micro-cap player in the Non Banking Financial Company (NBFC) sector, has seen its valuation metrics shift favourably, with its price-to-earnings (P/E) and price-to-book value (P/BV) ratios now classified as attractive. Despite this, the company’s financial performance and market returns remain mixed, prompting a cautious stance from analysts who recently upgraded its rating from Strong Sell to Sell.
Read full news articleAre Fedders Holding Ltd latest results good or bad?
Fedders Holding Ltd's latest financial results for Q4 FY26 present a complex picture of performance. The company reported net sales of ₹134.13 crores, reflecting a significant quarter-on-quarter growth of 68.34% and a year-on-year increase of 22.69%. This marks the highest quarterly revenue in the company's recent history, indicating sustained business activity. However, the operational performance reveals concerning trends. The company experienced an operating loss of ₹15.86 crores, resulting in an operating margin of -11.82%, which is the lowest in seven quarters. This decline in operational profitability highlights a fundamental weakness in Fedders Holding's business model, as the company increasingly relies on non-operating income for profitability. Despite a net profit of ₹23.74 crores, there was a sequential decline of 35.31%, primarily due to a drop in other income, which constituted 181.79% of prof...
Read full news article
Fedders Holding Ltd Upgraded to Sell as Technicals Improve Amid Mixed Financials
Fedders Holding Ltd, a micro-cap player in the Non Banking Financial Company (NBFC) sector, has seen its investment rating upgraded from Strong Sell to Sell as of 1 June 2026. This change reflects a nuanced shift in the company’s technical outlook amid persistent fundamental challenges and valuation concerns. While the stock has demonstrated some positive momentum recently, long-term performance and financial metrics continue to weigh on investor sentiment.
Read full news article Announcements
Disclosures under Reg. 29(2) of SEBI (SAST) Regulations 2011
05-Jun-2026 | Source : BSEThe Exchange has received the disclosure under Regulation 29(2) of SEBI (Substantial Acquisition of Shares & Takeovers) Regulations 2011 for Sonal Singhal
Announcement under Regulation 30 (LODR)-Newspaper Publication
01-Jun-2026 | Source : BSEPlease find the attached Newspaper Ad for the Audited Financial Results for the fourth quarter and year ended 31.03.2026.
Board Meeting Outcome for Regulation 30 And 33 Of The SEBI (Listing Obligations And Disclosure Requirements) Regulations 2015
29-May-2026 | Source : BSE1. The Audited Financial Results (Standalone and Consolidated) for the fourth quarter and year ended 31st March 2026 along with the report of Statutory Auditors thereon as recommended by the Audit Committee are enclosed herewith. The Statutory Auditors M/s. O. Aggarwal & Co. Chartered Accountants have issued their audit reports on the standalone and consolidated financial results of the Company. The audit report on the standalone financial results contains an unmodified opinion whereas the audit report on the consolidated financial results contains a modified opinion.
Corporate Actions

No Upcoming Board Meetings

Fedders Holding Ltd has declared 10% dividend, ex-date: 19 Sep 13

Fedders Holding Ltd has announced 1:10 stock split, ex-date: 20 Sep 24

No Bonus history available

No Rights history available
Quality key factors
Valuation key factors
Technicals key factors
 Technical Indicator Scale: Bearish, Mildly Bearish, Sideways, Mildly Bullish, Bullish Turned
 Shareholding Snapshot : Mar 2026
Shareholding Compare (%holding)
Promoters
None
Held by 0 Schemes
Held by 2 FIIs (0.09%)
Tirupati Containers Private Limited (24.58%)
Nippon Tubes Limited (1.72%)
21.37%
Quarterly Results Snapshot (Consolidated) - Mar'26 - QoQ

QoQ Growth in quarter ended Mar 2026 is 68.34% vs 48.82% in Dec 2025

QoQ Growth in quarter ended Mar 2026 is -35.31% vs 154.68% in Dec 2025
Half Yearly Results Snapshot (Consolidated) - Sep'25
Growth in half year ended Sep 2025 is -42.35% vs 14.83% in Sep 2024
Growth in half year ended Sep 2025 is 14.12% vs -31.69% in Sep 2024
Nine Monthly Results Snapshot (Consolidated) - Dec'25
YoY Growth in nine months ended Dec 2025 is -33.32% vs -18.06% in Dec 2024
YoY Growth in nine months ended Dec 2025 is 117.41% vs -61.85% in Dec 2024
Annual Results Snapshot (Consolidated) - Mar'26
YoY Growth in year ended Mar 2026 is -18.91% vs -19.16% in Mar 2025
YoY Growth in year ended Mar 2026 is 142.14% vs -59.74% in Mar 2025
About Fedders Holding Ltd

Company Coordinates


