
Compare Felix Industries with Similar Stocks
Dashboard
Strong ability to service debt as the company has a low Debt to EBITDA ratio of 1.20 times
Healthy long term growth as Net Sales has grown by an annual rate of 73.60% and Operating profit at 122.76%
With a growth in Net Sales of 116.38%, the company declared Very Positive results in Mar 26
Total Returns (Price + Dividend) 
Felix Industries for the last several years.
Risk Adjusted Returns v/s
Returns Beta

News

Felix Industries Ltd is Rated Buy
Felix Industries Ltd is rated 'Buy' by MarketsMOJO, with this rating last updated on 06 April 2026. However, the analysis and financial metrics discussed here reflect the stock's current position as of 11 June 2026, providing investors with an up-to-date view of its performance and prospects.
Read full news article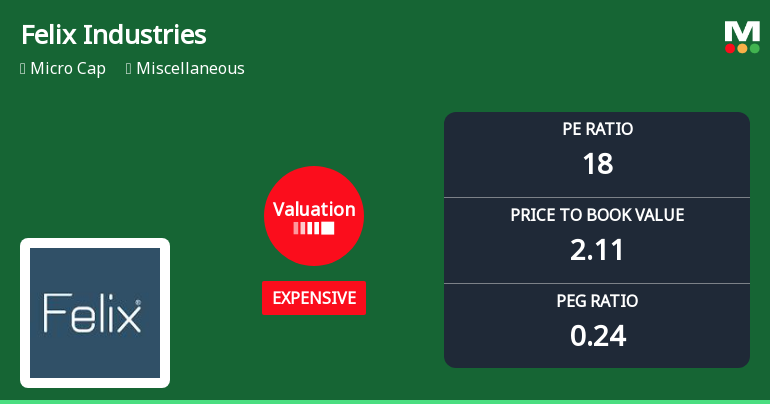
Felix Industries Ltd Valuation Shifts Signal Renewed Price Attractiveness
Felix Industries Ltd has witnessed a notable shift in its valuation parameters, moving from a very expensive to an expensive rating, reflecting a recalibration in price attractiveness amid mixed market signals. With a current P/E ratio of 17.67 and a P/BV of 2.11, the micro-cap company’s valuation now invites a closer examination against historical averages and peer benchmarks.
Read full news articleAre Felix Industries Ltd latest results good or bad?
Felix Industries Ltd's latest financial results for Q4 FY26 present a complex picture characterized by significant revenue growth alongside notable profitability challenges. The company reported a record revenue of ₹37.43 crores, which reflects a substantial year-on-year increase of 188.14% compared to ₹12.99 crores in Q4 FY25. This impressive topline growth indicates strong demand in the waste management sector, with a sequential revenue increase of 39.77% from ₹26.78 crores in Q3 FY26. However, the operational performance reveals underlying issues, particularly in profit margins. The net profit for Q4 FY26 was ₹4.09 crores, which represents a year-on-year growth of 25.85% but a sequential decline of 26.57% from the previous quarter. The profit after tax (PAT) margin has compressed sharply to 11.59%, down from 18.48% in Q3 FY26, highlighting significant margin erosion despite the revenue surge. This decli...
Read full news article Announcements
Felix Industries Limited - Statement of deviation(s) or variation(s) under Reg. 32
14-Nov-2019 | Source : NSEFelix Industries Limited has informed the Exchange regarding Statement of deviation(s) or variation(s) under Reg. 32 of SEBI (LODR) Regulations 2015
Felix Industries Limited - Updates
09-Oct-2019 | Source : NSEFelix Industries Limited has informed the Exchange regarding 'Non- Applicability of Corporate Governance Provisions.'.
Felix Industries Limited - Shareholders meeting
25-Sep-2019 | Source : NSEFelix Industries Limited has informed the Exchange regarding voting results of Annual General Meeting held on September 24, 2019
Corporate Actions

No Upcoming Board Meetings

No Dividend history available

No Splits history available

No Bonus history available

No Rights history available
Quality key factors
Valuation key factors
Technicals key factors
 Technical Indicator Scale: Bearish, Mildly Bearish, Sideways, Mildly Bullish, Bullish Turned
 Shareholding Snapshot : Mar 2026
Shareholding Compare (%holding)
Promoters
40.4589
Held by 0 Schemes
Held by 3 FIIs (1.28%)
Ritesh Vinay Patel (21.45%)
Nvs Corporate Consultancy Services Pvt. Ltd. (2.72%)
32.11%
Quarterly Results Snapshot (Standalone) - Mar'26 - YoY
Not Applicable: The company has declared_date for only one period
Not Applicable: The company has declared_date for only one period
Half Yearly Results Snapshot (Consolidated) - Mar'26

Growth in half year ended Mar 2026 is 68.97% vs 0.00% in Sep 2025
Growth in half year ended Mar 2026 is 4.25% vs 0.00% in Sep 2025
Nine Monthly Results Snapshot (Consolidated) - Dec'25
YoY Growth in nine months ended Dec 2025 is 171.84% vs -51.59% in Dec 2024
YoY Growth in nine months ended Dec 2025 is 182.13% vs -1.58% in Dec 2024
Annual Results Snapshot (Consolidated) - Mar'26
YoY Growth in year ended Mar 2026 is 177.59% vs 8.61% in Mar 2025
YoY Growth in year ended Mar 2026 is 120.41% vs 63.29% in Mar 2025
About Felix Industries Ltd

Company Coordinates


