
Compare Fine Sinter Co., Ltd. with Similar Stocks
Dashboard
1
With a growth in Net Sales of 2.76%, the company declared Very Positive results in Jun 25
- NET PROFIT(HY) Higher at JPY 982.91 MM
- ROCE(HY) Highest at 1.17%
- RAW MATERIAL COST(Y) Fallen by -40.52% (YoY)
2
With ROE of 7.54%, it has a risky valuation with a 0.25 Price to Book Value
3
Market Beating Performance
Stock DNA
Industrial Manufacturing
JPY 8,539 Million (Micro Cap)
3.00
NA
0.00%
0.72
12.19%
0.52
Revenue and Profits:
Net Sales:
10,975 Million
(Quarterly Results - Jun 2025)
Net Profit:
260 Million
Total Returns (Price + Dividend) 
TimePeriod
Price Return
Dividend Return
Total Return
3 Months
136.19%
0%
136.19%
6 Months
132.72%
0%
132.72%
1 Year
83.83%
0%
83.83%
2 Years
59.18%
0%
59.18%
3 Years
39.12%
0%
39.12%
4 Years
8.89%
0%
8.89%
5 Years
20.88%
0%
20.88%
Fine Sinter Co., Ltd. for the last several years.
Risk Adjusted Returns v/s
News
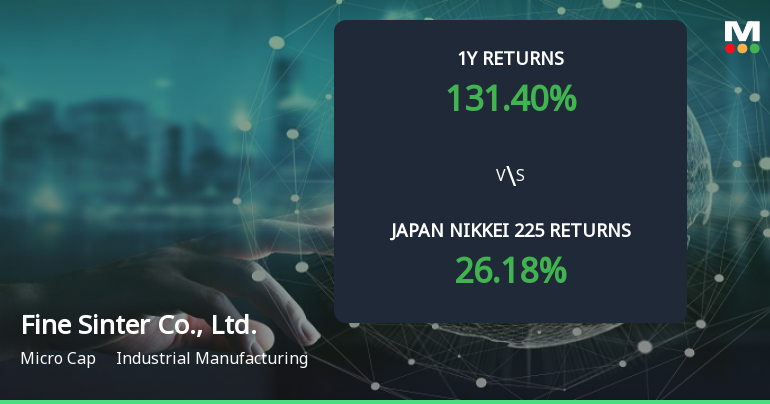
Fine Sinter Co., Ltd. Achieves 131.4% Return, Establishing It as a Multibagger in Industry
Fine Sinter Co., Ltd. has recently undergone a revision in its score, reflecting its strong performance metrics in the industrial manufacturing sector. The company has achieved impressive returns over the past year, significantly surpassing the Japan Nikkei 225, while also demonstrating robust financial health through increased net sales and profit.
Read full news article Announcements

No announcement available
Corporate Actions
No corporate action available
Quality key factors
Factor
Value
Sales Growth (5y)
1.16%
EBIT Growth (5y)
-14.88%
EBIT to Interest (avg)
0.39
Debt to EBITDA (avg)
3.19
Net Debt to Equity (avg)
0.94
Sales to Capital Employed (avg)
1.29
Tax Ratio
100.00%
Dividend Payout Ratio
0
Pledged Shares
0
Institutional Holding
0
ROCE (avg)
1.16%
ROE (avg)
2.28%
Valuation key factors
Factor
Value
P/E Ratio
3
Industry P/E
Price to Book Value
0.25
EV to EBIT
28.89
EV to EBITDA
4.41
EV to Capital Employed
0.61
EV to Sales
0.39
PEG Ratio
0.01
Dividend Yield
0.13%
ROCE (Latest)
2.12%
ROE (Latest)
7.54%
Technicals key factors
Indicator
Weekly
Monthly
MACD
Mildly Bearish
Bullish
RSI
No Signal
Bearish
Bollinger Bands
Bullish
Bullish
Moving Averages
Bullish (Daily)
KST
Mildly Bearish
Bullish
Dow Theory
Mildly Bearish
No Trend
OBV
Mildly Bearish
No Trend
 Technical Indicator Scale: Bearish, Mildly Bearish, Sideways, Mildly Bullish, Bullish Turned
 Shareholding Snapshot
No data for shareholding present.
Shareholding Compare (%holding)
No data for shareholding present.
Quarterly Results Snapshot (Consolidated) - Jun'25 - QoQ
Jun'25
Mar'25
Change(%)
Net Sales
10,974.80
11,268.50
-2.61%
Operating Profit (PBDIT) excl Other Income
996.20
1,597.20
-37.63%
Interest
94.90
106.20
-10.64%
Exceptional Items
21.80
-114.20
119.09%
Consolidate Net Profit
260.40
721.00
-63.88%
Operating Profit Margin (Excl OI)
20.30%
72.30%
-5.20%
USD in Million.

Net Sales
QoQ Growth in quarter ended Jun 2025 is -2.61% vs 6.34% in Mar 2025
Consolidated Net Profit
QoQ Growth in quarter ended Jun 2025 is -63.88% vs 152.54% in Mar 2025
Annual Results Snapshot (Consolidated) - Mar'25
Mar'25
Mar'24
Change(%)
Net Sales
42,720.40
42,391.00
0.78%
Operating Profit (PBDIT) excl Other Income
3,805.90
3,717.60
2.38%
Interest
436.00
369.00
18.16%
Exceptional Items
-1,291.90
-852.80
-51.49%
Consolidate Net Profit
-158.80
-606.40
73.81%
Operating Profit Margin (Excl OI)
13.60%
9.70%
0.39%
USD in Million.
Net Sales
YoY Growth in year ended Mar 2025 is 0.78% vs 6.85% in Mar 2024
Consolidated Net Profit
YoY Growth in year ended Mar 2025 is 73.81% vs 77.55% in Mar 2024
About Fine Sinter Co., Ltd.

Fine Sinter Co., Ltd.
Industrial Manufacturing
No Details Available.
Company Coordinates
No Company Details Available
InfinHub Market Technologies FZ-LLC, Building-2, Unit 112, Dubai Internet City, Dubai, United Arab Emirates
GET THE MARKETSMOJO APP


Company
Stocks
Portfolio


"Investment in securities markets are subject to market risk. Read all the related documents carefully before investing."