
Compare Fineotex Chem with Similar Stocks
Dashboard
High Management Efficiency with a high ROE of 20.06%
The company is Net-Debt Free
With a growth in Net Sales of 70.77%, the company declared Very Positive results in Mar 26
Majority shareholders : Promoters
Market Beating performance in long term as well as near term
Stock DNA
Specialty Chemicals
INR 4,490 Cr (Small Cap)
38.00
46
0.33%
-0.07
12.33%
4.72
Total Returns (Price + Dividend) 
Latest dividend: 0.07974501992031874 per share ex-dividend date: Oct-03-2025
Risk Adjusted Returns v/s
Returns Beta

News
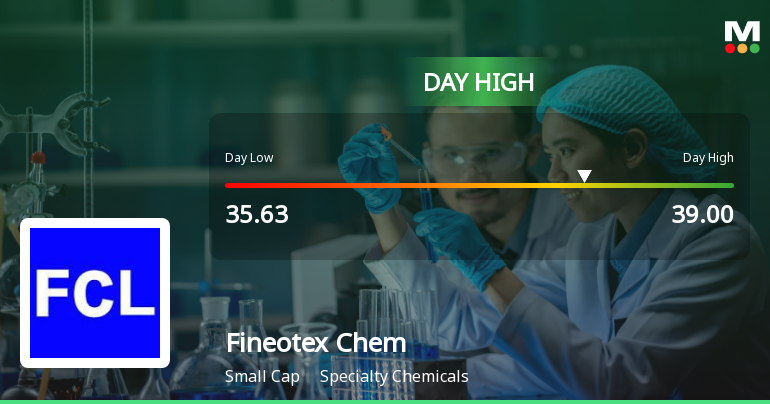
Fineotex Chemical Ltd Surges 8.53% to Day's High of Rs 39 — Outperforms Sector by 5.89 Percentage Points
The Sensex advanced 0.6% on 15 Jul 2026, yet Fineotex Chemical Ltd outpaced the broader market with an 8.53% gain, touching an intraday high of Rs 39. This 5.89 percentage-point outperformance over its Specialty Chemicals sector peers highlights a distinctly stock-specific rally on a day of broad market strength.
Read full news article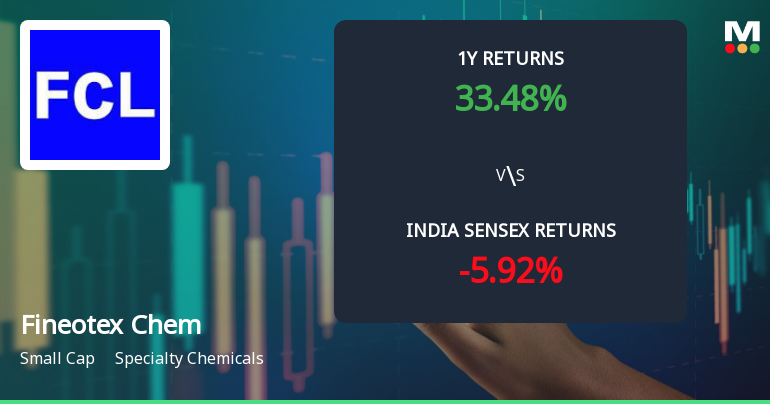
Fineotex Chemical Ltd Technical Momentum Shifts Amid Mixed Market Signals
Fineotex Chemical Ltd, a small-cap player in the specialty chemicals sector, has experienced a nuanced shift in its technical momentum, reflecting a transition from a bullish to a mildly bullish trend. Despite a recent dip in price, key technical indicators present a complex picture that investors should carefully analyse to gauge the stock’s near-term trajectory.
Read full news article
Fineotex Chemical Ltd is Rated Buy
Fineotex Chemical Ltd is rated Buy by MarketsMOJO, with this rating last updated on 16 May 2026. However, the analysis and financial metrics discussed here reflect the stock’s current position as of 13 July 2026, providing investors with the latest insights into its performance and prospects.
Read full news article Announcements
Compliances-Certificate under Reg. 74 (5) of SEBI (DP) Regulations 2018
10-Jul-2026 | Source : BSECertificate under Regulation 74(5) of SEBI (DP) Regulations 2018 for the quarter ended June 30 2026
Announcement under Regulation 30 (LODR)-Newspaper Publication
30-Jun-2026 | Source : BSENewspaper Publication of Notice to shareholders
Closure of Trading Window
29-Jun-2026 | Source : BSEClosure of the Trading Window for the quarter ended June 30 2026
Corporate Actions

No Upcoming Board Meetings

Fineotex Chemical Ltd has declared 40% dividend, ex-date: 03 Oct 25

Fineotex Chemical Ltd has announced 1:2 stock split, ex-date: 31 Oct 25

Fineotex Chemical Ltd has announced 4:1 bonus issue, ex-date: 31 Oct 25

No Rights history available
Quality key factors
Valuation key factors
Technicals key factors
 Technical Indicator Scale: Bearish, Mildly Bearish, Sideways, Mildly Bullish, Bullish Turned
 Shareholding Snapshot : Jun 2026
Shareholding Compare (%holding)
Promoters
None
Held by 2 Schemes (1.27%)
Held by 44 FIIs (3.16%)
Surendrakumar Deviprasad Tibrewala (52.28%)
Ashish Kacholia (2.06%)
29.47%
Quarterly Results Snapshot (Consolidated) - Mar'26 - QoQ

QoQ Growth in quarter ended Mar 2026 is 70.77% vs 33.40% in Dec 2025
QoQ Growth in quarter ended Mar 2026 is 19.96% vs 1.39% in Dec 2025
Half Yearly Results Snapshot (Consolidated) - Sep'25

Growth in half year ended Sep 2025 is -4.47% vs 3.65% in Sep 2024
Growth in half year ended Sep 2025 is -16.17% vs 6.26% in Sep 2024
Nine Monthly Results Snapshot (Consolidated) - Dec'25
YoY Growth in nine months ended Dec 2025 is 10.87% vs -0.58% in Dec 2024
YoY Growth in nine months ended Dec 2025 is -12.56% vs -1.64% in Dec 2024
Annual Results Snapshot (Consolidated) - Mar'26
YoY Growth in year ended Mar 2026 is 44.79% vs -6.26% in Mar 2025
YoY Growth in year ended Mar 2026 is 0.50% vs -9.68% in Mar 2025
About Fineotex Chemical Ltd

Company Coordinates


