
Compare Fineotex Chem with Similar Stocks
Dashboard
High Management Efficiency with a high ROE of 20.06%
The company is Net-Debt Free
With a growth in Net Sales of 70.77%, the company declared Very Positive results in Mar 26
Majority shareholders : Promoters
Market Beating performance in long term as well as near term
Stock DNA
Specialty Chemicals
INR 5,201 Cr (Small Cap)
49.00
44
0.26%
-0.07
12.33%
5.98
Total Returns (Price + Dividend) 
Latest dividend: 0.07974501992031874 per share ex-dividend date: Oct-03-2025
Risk Adjusted Returns v/s
Returns Beta

News
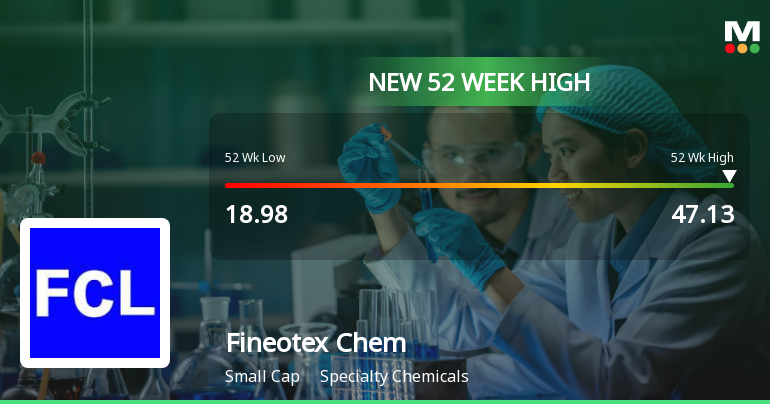
Broad-Based Technical Strength Lifts Fineotex Chemical Ltd to 52-Week High of Rs 47.13
With a decisive break above Rs 47.13 on 23 Jun 2026, Fineotex Chemical Ltd has reached a fresh 52-week high, extending its impressive rally that has delivered 66.82% returns over the past year. This milestone comes amid a backdrop of strong technical momentum and sustained outperformance versus the broader market indices.
Read full news article

Fineotex Chemical Ltd is Rated Buy
Fineotex Chemical Ltd is rated Buy by MarketsMOJO, with this rating last updated on 16 May 2026. However, the analysis and financial metrics discussed here reflect the stock’s current position as of 21 June 2026, providing investors with the latest insights into its performance and outlook.
Read full news article Announcements
Announcement under Regulation 30 (LODR)-Analyst / Investor Meet - Intimation
19-Jun-2026 | Source : BSESchedule of Investor/Analyst Meet to be held on Wednesday June 24 2026
Announcement under Regulation 30 (LODR)-Analyst / Investor Meet - Intimation
15-Jun-2026 | Source : BSEParticipation in Investor Webinar titled Management Spotlight
Announcement under Regulation 30 (LODR)-Analyst / Investor Meet - Intimation
13-Jun-2026 | Source : BSESchedule of Investor/Analyst Meet to be held on Wednesday June 17 2026
Corporate Actions

No Upcoming Board Meetings

Fineotex Chemical Ltd has declared 40% dividend, ex-date: 03 Oct 25

Fineotex Chemical Ltd has announced 1:2 stock split, ex-date: 31 Oct 25

Fineotex Chemical Ltd has announced 4:1 bonus issue, ex-date: 31 Oct 25

No Rights history available
Quality key factors
Valuation key factors
Technicals key factors
 Technical Indicator Scale: Bearish, Mildly Bearish, Sideways, Mildly Bullish, Bullish Turned
 Shareholding Snapshot : Mar 2026
Shareholding Compare (%holding)
Promoters
None
Held by 2 Schemes (1.27%)
Held by 35 FIIs (2.92%)
Surendrakumar Deviprasad Tibrewala (52.28%)
Ashish Kacholia (2.58%)
29.75%
Quarterly Results Snapshot (Consolidated) - Mar'26 - QoQ

QoQ Growth in quarter ended Mar 2026 is 70.77% vs 33.40% in Dec 2025
QoQ Growth in quarter ended Mar 2026 is 19.96% vs 1.39% in Dec 2025
Half Yearly Results Snapshot (Consolidated) - Sep'25

Growth in half year ended Sep 2025 is -4.47% vs 3.65% in Sep 2024
Growth in half year ended Sep 2025 is -16.17% vs 6.26% in Sep 2024
Nine Monthly Results Snapshot (Consolidated) - Dec'25
YoY Growth in nine months ended Dec 2025 is 10.87% vs -0.58% in Dec 2024
YoY Growth in nine months ended Dec 2025 is -12.56% vs -1.64% in Dec 2024
Annual Results Snapshot (Consolidated) - Mar'26
YoY Growth in year ended Mar 2026 is 44.79% vs -6.26% in Mar 2025
YoY Growth in year ended Mar 2026 is 0.50% vs -9.68% in Mar 2025
About Fineotex Chemical Ltd

Company Coordinates


