
Compare Fineotex Chem with Similar Stocks
Stock DNA
Specialty Chemicals
INR 4,482 Cr (Small Cap)
40.00
42
0.31%
-0.07
12.33%
5.06
Total Returns (Price + Dividend) 
Latest dividend: 0.8 per share ex-dividend date: Oct-03-2025
Risk Adjusted Returns v/s
Returns Beta

News

Fineotex Chemical Ltd is Rated Buy
Fineotex Chemical Ltd is rated Buy by MarketsMOJO, with this rating last updated on 16 May 2026. However, the analysis and financial metrics presented here reflect the stock’s current position as of 10 June 2026, providing investors with the latest insights into its performance and outlook.
Read full news article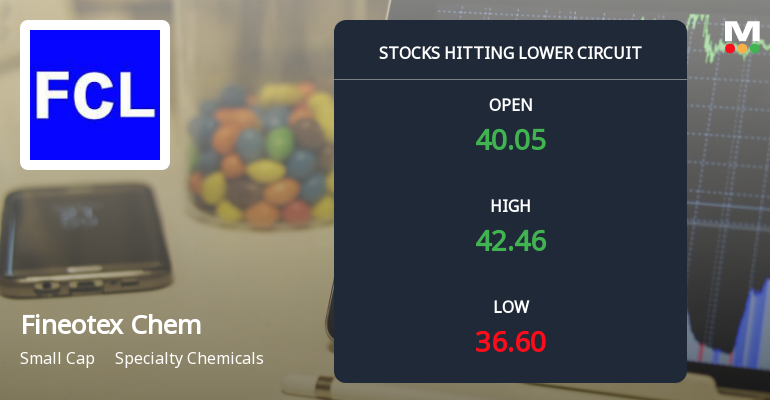
Fineotex Chemical Ltd Locks at Lower Circuit With 9.99% Loss — Sellers Queue, No Buyers in Sight
At Rs 36.66, sellers were still queuing — but there were no buyers willing to take the other side. Fineotex Chemical Ltd locked at its lower circuit of 9.99% on 8 Jun 2026, with unfilled sell orders and a frozen price, reflecting a pronounced imbalance in supply and demand.
Read full news article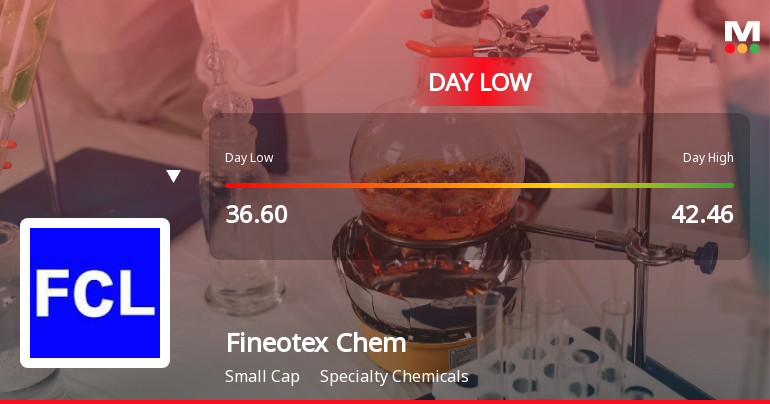
Fineotex Chemical Ltd Hits Intraday Low Amid Price Pressure on 8 June 2026
Fineotex Chemical Ltd witnessed a notable decline today, touching an intraday low of Rs 38.12, reflecting a 6.25% drop from its previous close. The stock underperformed its sector and broader market indices, weighed down by persistent selling pressure and a challenging market environment.
Read full news article Announcements
Announcement under Regulation 30 (LODR)-Analyst / Investor Meet - Intimation
09-Jun-2026 | Source : BSESchedule of Investor Meet
Announcement under Regulation 30 (LODR)-Press Release / Media Release
08-Jun-2026 | Source : BSEPress Release on Expansion of Manufacturing Capcity
Compliances-Reg.24(A)-Annual Secretarial Compliance
28-May-2026 | Source : BSEAnnual Secretarial Compliance Report for the year ended March 31 2026
Corporate Actions

No Upcoming Board Meetings

Fineotex Chemical Ltd has declared 40% dividend, ex-date: 03 Oct 25

Fineotex Chemical Ltd has announced 1:2 stock split, ex-date: 31 Oct 25

Fineotex Chemical Ltd has announced 4:1 bonus issue, ex-date: 31 Oct 25

No Rights history available
Quality key factors
Valuation key factors
Technicals key factors
 Technical Indicator Scale: Bearish, Mildly Bearish, Sideways, Mildly Bullish, Bullish Turned
 Shareholding Snapshot : Mar 2026
Shareholding Compare (%holding)
Promoters
None
Held by 2 Schemes (1.27%)
Held by 35 FIIs (2.92%)
Surendrakumar Deviprasad Tibrewala (52.28%)
Ashish Kacholia (2.58%)
29.75%
Quarterly Results Snapshot (Consolidated) - Mar'26 - QoQ

QoQ Growth in quarter ended Mar 2026 is 70.77% vs 33.40% in Dec 2025
QoQ Growth in quarter ended Mar 2026 is 19.96% vs 1.39% in Dec 2025
Half Yearly Results Snapshot (Consolidated) - Sep'25

Growth in half year ended Sep 2025 is -4.47% vs 3.65% in Sep 2024
Growth in half year ended Sep 2025 is -16.17% vs 6.26% in Sep 2024
Nine Monthly Results Snapshot (Consolidated) - Dec'25
YoY Growth in nine months ended Dec 2025 is 10.87% vs -0.58% in Dec 2024
YoY Growth in nine months ended Dec 2025 is -12.56% vs -1.64% in Dec 2024
Annual Results Snapshot (Consolidated) - Mar'26
YoY Growth in year ended Mar 2026 is 44.79% vs -6.26% in Mar 2025
YoY Growth in year ended Mar 2026 is 0.50% vs -9.68% in Mar 2025
About Fineotex Chemical Ltd

Company Coordinates


