
Compare Fino Payments with Similar Stocks
Stock DNA
Financial Technology (Fintech)
INR 1,100 Cr (Small Cap)
19.00
20
0.00%
0.00
7.43%
1.47
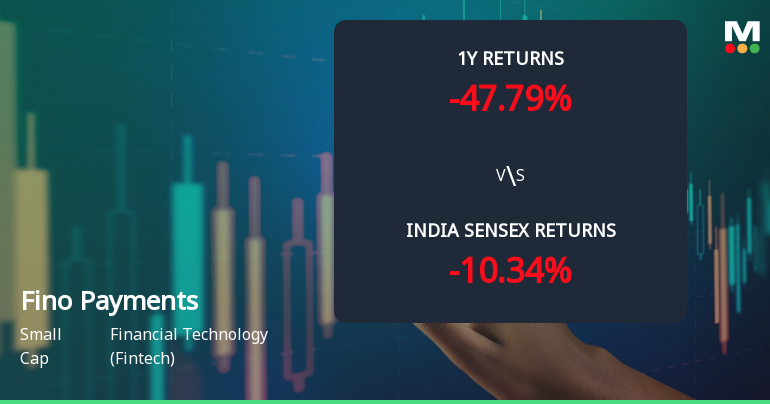
Total Returns (Price + Dividend) 
Fino Payments for the last several years.
Risk Adjusted Returns v/s
Returns Beta

News
Fino Payments Bank Ltd Sees Mixed Technical Signals Amid Price Momentum Shift
Fino Payments Bank Ltd has experienced a notable shift in price momentum, reflected in a 9.3% surge in its share price to ₹139.90 on 10 June 2026. Despite this intraday strength, technical indicators present a complex picture, with a transition from bearish to mildly bearish trends and a divergence in signals across weekly and monthly timeframes. This analysis delves into the technical parameters shaping the stock’s outlook and contextualises its performance against broader market benchmarks.
Read full news article
Fino Payments Bank Ltd is Rated Sell
Fino Payments Bank Ltd is rated 'Sell' by MarketsMOJO, with this rating last updated on 08 Dec 2025. However, the analysis and financial metrics discussed here reflect the stock's current position as of 09 June 2026, providing investors with an up-to-date view of its fundamentals, valuation, financial trends, and technical outlook.
Read full news article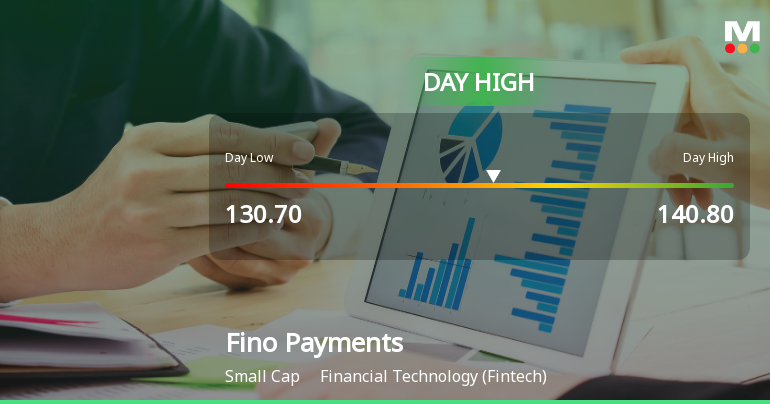
Fino Payments Bank Ltd Surges 8.79% to Day's High of Rs 139.95 — Outperforms Sector by 7.56 Percentage Points
The Sensex edged up by a modest 0.28% on 09 Jun 2026, but Fino Payments Bank Ltd surged 8.79%, sharply outperforming its Financial Technology sector by 7.56 percentage points. This standout session saw the stock touch an intraday high of Rs 139.95, marking a significant single-day gain that rewrites the short-term narrative for this small-cap fintech player.
Read full news article Announcements
Announcement under Regulation 30 (LODR)-Analyst / Investor Meet - Intimation
08-Jun-2026 | Source : BSEInvestor meet with Fortuna Asset Managers LLP
Business Performance Updates-May 2026
08-Jun-2026 | Source : BSEBusiness Update
Fino Payments Bank Limited Announces Strategic Partnership With Ezee.Ai To Build Lending Eco-System For Seamless Small Finance Bank Transition
01-Jun-2026 | Source : BSEStrategic Partnership with Ezee.ai
Corporate Actions

No Upcoming Board Meetings

No Dividend history available

No Splits history available

No Bonus history available

No Rights history available
Quality key factors
Valuation key factors
Technicals key factors
 Technical Indicator Scale: Bearish, Mildly Bearish, Sideways, Mildly Bullish, Bullish Turned
 Shareholding Snapshot : Mar 2026
Shareholding Compare (%holding)
Promoters
None
Held by 1 Schemes (0.0%)
Held by 22 FIIs (1.33%)
Fino Paytech Limited (75.0%)
Zodiac Wealth Advisors Llp (1.07%)
17.43%
Quarterly Results Snapshot (Standalone) - Mar'26 - QoQ

QoQ Growth in quarter ended Mar 2026 is 1.81% vs 4.74% in Dec 2025
QoQ Growth in quarter ended Mar 2026 is -41.86% vs -5.99% in Dec 2025
Half Yearly Results Snapshot (Standalone) - Sep'25
Growth in half year ended Sep 2025 is 30.09% vs 33.98% in Sep 2024
Growth in half year ended Sep 2025 is -27.10% vs 18.84% in Sep 2024
Nine Monthly Results Snapshot (Standalone) - Dec'25
YoY Growth in nine months ended Dec 2025 is 29.22% vs 31.12% in Dec 2024
YoY Growth in nine months ended Dec 2025 is -30.63% vs 12.31% in Dec 2024
Annual Results Snapshot (Standalone) - Mar'26
YoY Growth in year ended Mar 2026 is 27.12% vs 30.11% in Mar 2025
YoY Growth in year ended Mar 2026 is -39.61% vs 7.32% in Mar 2025
About Fino Payments Bank Ltd

Company Coordinates


