
Compare Finolex Inds. with Similar Stocks
Stock DNA
Plastic Products - Industrial
INR 10,567 Cr (Small Cap)
18.00
35
2.10%
-0.33
9.64%
1.71
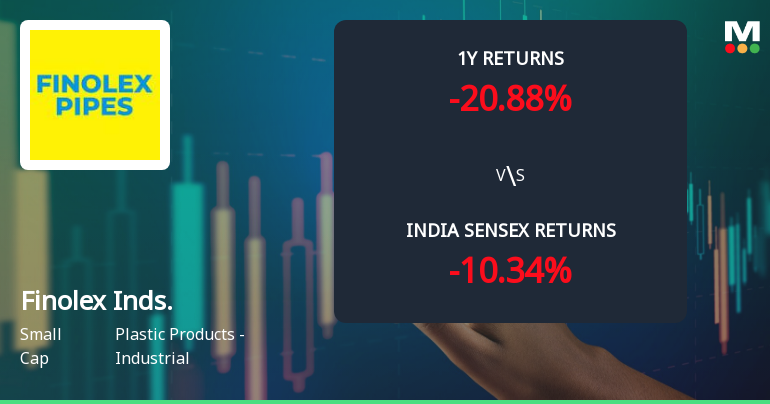
Total Returns (Price + Dividend) 
Latest dividend: 2 per share ex-dividend date: Sep-04-2025
Risk Adjusted Returns v/s
Returns Beta

News
Finolex Industries Ltd Technical Momentum Shifts Amid Mixed Market Signals
Finolex Industries Ltd has experienced a nuanced shift in its technical momentum, reflecting a complex interplay of bullish and bearish signals across multiple timeframes. Despite a recent upgrade from a Hold to a Sell rating by MarketsMOJO, the stock’s price action and technical indicators reveal a landscape of cautious optimism tempered by underlying weaknesses.
Read full news article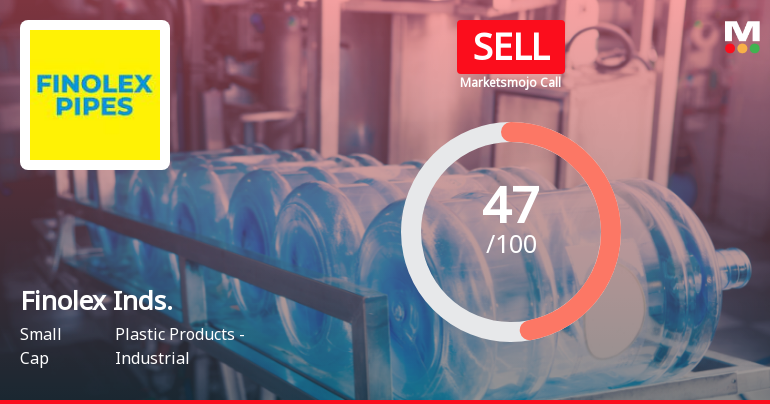
Finolex Industries Downgraded to Sell Amid Mixed Financial and Market Signals
Finolex Industries Ltd, a small-cap player in the Plastic Products - Industrial sector, has been downgraded from Hold to Sell by MarketsMOJO as of 8 June 2026. Despite some positive quarterly financial results, the company’s long-term growth prospects, valuation metrics, and technical indicators have deteriorated, prompting a reassessment of its investment appeal.
Read full news article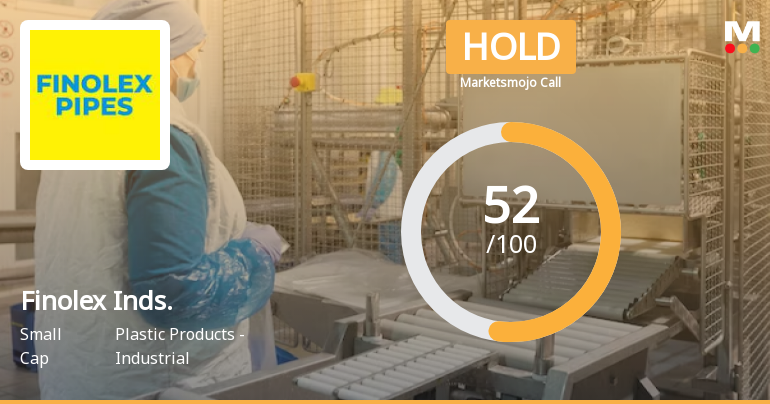
Finolex Industries Ltd is Rated Hold by MarketsMOJO
Finolex Industries Ltd is rated 'Hold' by MarketsMOJO, with this rating last updated on 27 May 2026. However, the analysis and financial metrics discussed here reflect the company’s current position as of 03 June 2026, providing investors with the latest insights into its performance and outlook.
Read full news article Announcements
Announcement under Regulation 30 (LODR)-Earnings Call Transcript
03-Jun-2026 | Source : BSETranscript of the Earnings Call held on May 27 2026
Compliances-Reg.24(A)-Annual Secretarial Compliance
29-May-2026 | Source : BSEAnnual Secretarial Compliance Report for FY 2025-26
Announcement under Regulation 30 (LODR)-Newspaper Publication
28-May-2026 | Source : BSENewspaper Publication of Audited Financial Results for the Quarter and Year ended 31st March 2026
Corporate Actions

No Upcoming Board Meetings

Finolex Industries Ltd has declared 100% dividend, ex-date: 04 Sep 25

Finolex Industries Ltd has announced 2:10 stock split, ex-date: 15 Apr 21

No Bonus history available

No Rights history available
Quality key factors
Valuation key factors
Technicals key factors
 Technical Indicator Scale: Bearish, Mildly Bearish, Sideways, Mildly Bullish, Bullish Turned
 Shareholding Snapshot : Mar 2026
Shareholding Compare (%holding)
Promoters
None
Held by 14 Schemes (11.36%)
Held by 127 FIIs (5.87%)
Finolex Cables Ltd. (32.39%)
Sbi Conservative Hybrid Fund (6.08%)
22.54%
Quarterly Results Snapshot (Consolidated) - Mar'26 - YoY

YoY Growth in quarter ended Mar 2026 is 12.12% vs -5.15% in Mar 2025
YoY Growth in quarter ended Mar 2026 is 58.74% vs -0.19% in Mar 2025
Half Yearly Results Snapshot (Consolidated) - Sep'25
Growth in half year ended Sep 2025 is -3.40% vs -4.53% in Sep 2024

Growth in half year ended Sep 2025 is -59.05% vs 153.83% in Sep 2024
Nine Monthly Results Snapshot (Consolidated) - Dec'25
YoY Growth in nine months ended Dec 2025 is -5.74% vs -3.63% in Dec 2024
YoY Growth in nine months ended Dec 2025 is -46.84% vs 105.84% in Dec 2024
Annual Results Snapshot (Consolidated) - Mar'26
YoY Growth in year ended Mar 2026 is -0.69% vs -4.06% in Mar 2025
YoY Growth in year ended Mar 2026 is -25.12% vs 68.93% in Mar 2025
About Finolex Industries Ltd

Company Coordinates


