
Compare First Fintec with Similar Stocks
Dashboard
With a Operating Losses, the company has a Weak Long Term Fundamental Strength
- Poor long term growth as Operating profit has grown by an annual rate 14.57% of over the last 5 years
- Company's ability to service its debt is weak with a poor EBIT to Interest (avg) ratio of -1.42
Flat results in Mar 26
Risky - Negative EBITDA
Stock DNA
Software Products
INR 10 Cr (Micro Cap)
NA (Loss Making)
20
0.00%
0.02
-0.57%
0.89
Total Returns (Price + Dividend) 
Latest dividend: 0.1 per share ex-dividend date: Mar-12-2012
Risk Adjusted Returns v/s
Returns Beta

News
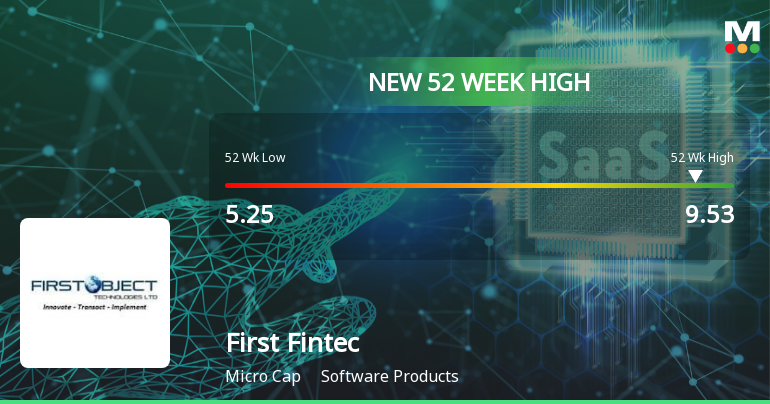
Broad-Based Technical Strength Lifts First Fintec Ltd to 52-Week High of Rs 9.53
With a sustained rally over the past eight trading sessions, First Fintec Ltd has surged to a fresh 52-week high of Rs 9.53 on 16 Jun 2026, marking a remarkable 38.92% gain during this period and outperforming its sector by 3.9% today.
Read full news article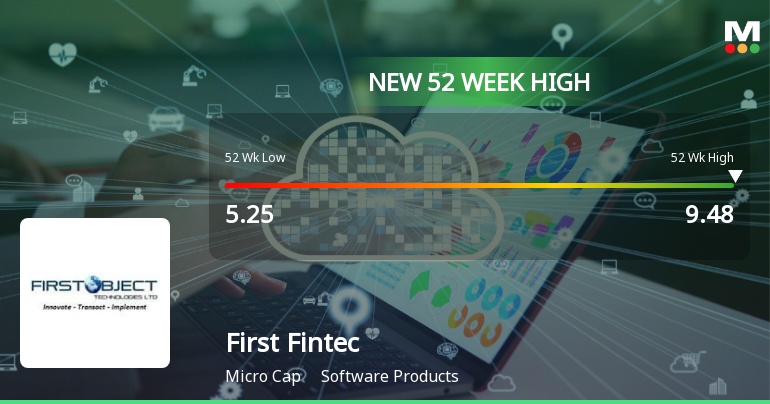
Broad-Based Technical Strength Lifts First Fintec Ltd to 52-Week High of Rs 9.48
With a sustained seven-day rally culminating in a fresh 52-week high of Rs 9.48 on 15 Jun 2026, First Fintec Ltd has demonstrated remarkable price momentum, outpacing its sector and the broader market by a significant margin.
Read full news article
First Fintec Ltd Upgraded to Sell on Technical Improvements Despite Weak Fundamentals
First Fintec Ltd, a micro-cap player in the Software Products sector, has seen its investment rating upgraded from Strong Sell to Sell as of 2 June 2026. This change reflects a nuanced shift in the company’s technical outlook, even as fundamental challenges persist. The upgrade is primarily driven by improvements in technical indicators, while valuation and financial trends continue to weigh on investor sentiment.
Read full news article Announcements
Announcement under Regulation 30 (LODR)-Newspaper Publication
03-Jun-2026 | Source : BSEDear Sir Please find the attachment. Regards For First Fintec Limited Compliance Officer/ Authorised Signatory
Audited Results For The Quarter And The Financial Year Ended On 31St March 2026-Outcome Of Board Meeting-Quarterly Submission Of Financial Results Under Regulation 33 Of SEBI Listing Regulations 2015 (LODR).
30-May-2026 | Source : BSEDear Sir Please find the attachment. Regards For First Fintec Limited Compliance Officer
Board Meeting Outcome for Outcome Of Board Meeting-Quarterly Submission Of Financial Results Under Regulation 33 Of SEBI Listing Regulations 2015 (LODR) - Audited Results For The Quarter And The Financial Year Ended 31St March 2026.
30-May-2026 | Source : BSEDear Sir Please find the attachment. Regards For First Fintec Limited Compliance Officer
Corporate Actions

No Upcoming Board Meetings

First Fintec Ltd has declared 1% dividend, ex-date: 12 Mar 12

First Fintec Ltd has announced 10:3 stock split, ex-date: 25 Jul 11

No Bonus history available

No Rights history available
Quality key factors
Valuation key factors
Technicals key factors
 Technical Indicator Scale: Bearish, Mildly Bearish, Sideways, Mildly Bullish, Bullish Turned
 Shareholding Snapshot : Mar 2026
Shareholding Compare (%holding)
Non Institution
None
Held by 0 Schemes
Held by 0 FIIs
First Call India Equity Advisors Pvt Ltd (47.4%)
Rishit Dinesh Maniar Huf (4.28%)
44.31%
Quarterly Results Snapshot (Standalone) - Mar'26 - QoQ

QoQ Growth in quarter ended Mar 2026 is -44.16% vs 13.24% in Dec 2025
QoQ Growth in quarter ended Mar 2026 is -306.25% vs 166.67% in Dec 2025
Half Yearly Results Snapshot (Standalone) - Sep'25

Growth in half year ended Sep 2025 is 49.44% vs 9.88% in Sep 2024
Growth in half year ended Sep 2025 is 283.33% vs 66.67% in Sep 2024
Nine Monthly Results Snapshot (Standalone) - Dec'25
YoY Growth in nine months ended Dec 2025 is 50.00% vs 8.53% in Dec 2024
YoY Growth in nine months ended Dec 2025 is 35.00% vs 350.00% in Dec 2024
Annual Results Snapshot (Standalone) - Mar'26
YoY Growth in year ended Mar 2026 is 38.25% vs 2.23% in Mar 2025
YoY Growth in year ended Mar 2026 is 50.00% vs 47.37% in Mar 2025
About First Fintec Ltd

Company Coordinates


