Fischer Medical

  • Market Cap: Small Cap
  • Industry: Commodity Chemicals
  • ISIN: INE771F01041
  • NSEID: FISCHER
  • BSEID: 524743
INR
46.77
-1.39 (-2.89%)
BSENSE

Dec 04

BSE+NSE Vol: 17.85 lacs

  • Price Points
  • Score
  • Mojo Parameters
  • Total Return
  • News and Corporate Actions
  • Key factors
  • Shareholding
  • Financials
  • CompanyCV
stock-summaryPrice Point
High/Low

1Day

52 Week

Valuation
Technical
Day's Volume

CASH

17.85 lacs (-57.32%) Volume

Shareholding (Sep 2025)

FII

5.57%

Held by 7 FIIs

DII

1.42%

Held by 5 DIIs

Promoter

61.80%

Who are the top shareholders of the Fischer Medical?

06-Jun-2025

The top shareholder of Fischer Medical is Time Medical International Ventures Pte, holding 51.16%. Other significant shareholders include four Foreign Institutional Investors with 5.38%, and individual investors with 27.48%, while the highest public shareholder is Roopal Hitesh Kawa at 2.78%.

The top shareholders of Fischer Medical include Time Medical International Ventures Pte, which holds the largest stake at 51.16%. Additionally, there are four Foreign Institutional Investors (FIIs) that collectively own 5.38%. The highest public shareholder is Roopal Hitesh Kawa, with a holding of 2.78%. Individual investors also have a significant presence, holding 27.48% of the shares. Overall, the majority of the company's shares are held by promoters, and there are no pledged promoter holdings.

Read More

how big is Fischer Medical?

06-Jun-2025

As of Jun 06, Fischer Medical Ventures Ltd has a market capitalization of 5,619.39 Cr, with recent net sales of 110.70 Cr and a net profit of 1.38 Cr. The shareholder's funds are valued at 81.11 Cr, and total assets amount to 86.32 Cr.

Market Cap: As of Jun 06, Fischer Medical Ventures Ltd has a market capitalization of 5,619.39 Cr, which categorizes it as a Mid Cap company.<BR><BR>Recent Quarterly Performance: For the latest 4 quarters, the company reported Net Sales of 110.70 Cr and a Net Profit of 1.38 Cr. This data is on a Consolidated basis.<BR><BR>Balance Sheet Snapshot: This is also on a Consolidated basis for the latest annual period ending in Mar'24. The Shareholder's Funds are valued at 81.11 Cr, and the Total Assets amount to 86.32 Cr.

Read More

Who are in the management team of Fischer Medical?

06-Jun-2025

As of March 2023, the management team of Fischer Medical includes Sejal Soni (Non Executive Director), Ashishkumar Dhakan (Independent Non Executive Director), Krishna Kumar Omprakash Dubey (Independent Director), Jeena Dineshchandra Suthar (Independent Women Director), and Dilip Suryakant Jha (Director & CFO).

As of March 2023, the management team of Fischer Medical includes the following individuals:<BR><BR>1. Sejal Soni - Non Executive Director<BR>2. Ashishkumar Dhakan - Independent Non Executive Director<BR>3. Krishna Kumar Omprakash Dubey - Independent Director<BR>4. Jeena Dineshchandra Suthar - Independent Women Director<BR>5. Dilip Suryakant Jha - Director & CFO<BR><BR>These members play various roles within the company's governance structure.

Read More

Has Fischer Medical declared dividend?

06-Jun-2025

No Dividend History Available

Who are the peers of the Fischer Medical?

03-Jun-2025

Fischer Medical's peers include Tata Chemicals, Chemplast Sanmar, GHCL, India Glycols, Gujarat Alkalies, Grauer & Weil, Tanfac Inds., Thirumalai Chem., Blue Pearl Agri, and J.G.Chemicals. In terms of management risk, Fischer Medical has Below Average risk, with a 1-year return of 54.55%, which is higher than Gujarat Alkalies but lower than India Glycols.

Peers: The peers of Fischer Medical are Tata Chemicals, Chemplast Sanmar, GHCL, India Glycols, Gujarat Alkalies, Grauer & Weil, Tanfac Inds., Thirumalai Chem., Blue Pearl Agri, and J.G.Chemicals.<BR><BR>Quality Snapshot: Excellent management risk is observed at GHCL and Chemplast Sanmar, while Average management risk is found at Tata Chemicals, Grauer & Weil, Tanfac Inds., Thirumalai Chem., and J.G.Chemicals, and the rest. Below Average management risk is noted at Fischer Medical, Gujarat Alkalies, and India Glycols. For Growth, Excellent growth is seen at Tanfac Inds., while Average growth is reported for Fischer Medical, and the rest have Below Average growth. In terms of Capital Structure, Excellent capital structure is held by GHCL and Gujarat Alkalies, Good capital structure is noted at Fischer Medical, while Average capital structure is found at Tata Chemicals, Grauer & Weil, Thirumalai Chem., and J.G.Chemicals, and the rest.<BR><BR>Return Snapshot: India Glycols has the highest 1-year return at 150.38%, while Gujarat Alkalies has the lowest at -25.63%. Fischer Medical's 1-year return of 54.55% is significantly higher than Gujarat Alkalies but lower than India Glycols. Additionally, peers with negative six-month returns include Tata Chemicals, Gujarat Alkalies, Grauer & Weil, and Thirumalai Chem.

Read More

Is Fischer Medical overvalued or undervalued?

09-Jun-2025

As of June 1, 2024, Fischer Medical is considered very expensive with a PE ratio of 3780.80 and other high valuation metrics, despite impressive returns of 22.64% YTD and 1231.22% over three years, indicating it is overvalued compared to its peers.

As of 1 June 2024, Fischer Medical's valuation grade has moved from does not qualify to very expensive, indicating a significant shift in its perceived value. The company's current valuation suggests it is overvalued, particularly highlighted by its staggering PE ratio of 3780.80, an EV to EBITDA of 1624.03, and a Price to Book Value of 18.09. These ratios are exceptionally high compared to its peers, such as Solar Industries with a PE of 123.77 and Godrej Industries, which is considered attractive with a PE of 46.63.<BR><BR>In comparison to its industry, Fischer Medical stands out as very expensive, with its valuation metrics far exceeding those of its competitors. The company's return performance has been impressive, with a YTD return of 22.64% compared to the Sensex's 5.66%, and a remarkable 3-year return of 1231.22% against 49.24% for the Sensex. However, despite these strong returns, the current valuation metrics indicate that Fischer Medical is overvalued in the market.

Read More

What does Fischer Medical do?

17-Jul-2025

Fischer Medical Ventures Ltd specializes in trading MRI systems within the Commodity Chemicals industry and has a market capitalization of INR 5,448 Cr. As of March 2025, it reported net sales of 492 Cr and a net profit of 15 Cr.

Overview: <BR>Fischer Medical Ventures Ltd is emerging as a leading player in the trading of MRI systems within the Commodity Chemicals industry and falls under the Mid Cap market-cap bracket.<BR><BR>History: <BR>Fischer Medical Ventures Ltd was incorporated in an unspecified year and has established itself as a significant player in the medical diagnostic and imaging technologies market. The latest quarterly results reported are for March 2025, showing net sales and profit figures.<BR><BR>Financial Snapshot: <BR>Most recent Net Sales: 492 Cr (Quarterly Results - Mar 2025) <BR>Most recent Net Profit: 15 Cr (Quarterly Results - Mar 2025) <BR>Market-cap value: INR 5,448 Cr (Mid Cap)<BR><BR>Key Metrics: <BR>P/E: 4,108.00 <BR>Industry P/E: 47 <BR>Dividend Yield: 0.00% <BR>Debt-Equity: -0.54 <BR>Return on Equity: 0.48% <BR>Price to Book: 16.79<BR><BR>Contact Details: <BR>Address: 104 1st Fl Bhhind Poisar Depot, Raghuleela Mall Kandivali (W) Mumbai Maharashtra : 400067 <BR>Email: fischerchemicltd@gmail.com <BR>Website: http://www.fischerchemic.in

Read More

When is the next results date for Fischer Medical?

06-Aug-2025

Fischer Medical will announce its results on 14 August 2025.

Fischer Medical will declare its results on 14 August 2025.

Read More

Are Fischer Medical latest results good or bad?

29-Oct-2025

Fischer Medical's Q2 FY26 results are strong, with a net profit increase of 177.45% and revenue growth of 268.22%. However, high valuation multiples raise concerns about sustainability for potential investors.

Fischer Medical's latest results for Q2 FY26 can be considered quite strong overall. The company reported a net profit of ₹13.90 crore, which is a significant increase of 177.45% compared to the previous quarter. Revenue also surged dramatically by 268.22%, reaching ₹86.31 crore, reflecting robust growth in their MRI systems trading business.<BR><BR>Additionally, the operating margin improved to a record 18.84%, indicating strong operational efficiency. The profit after tax margin of 16.10% remains above historical averages, despite a slight decline from the previous quarter due to a normalization of the tax rate.<BR><BR>However, it's important to note that while the growth figures are impressive, there are concerns regarding the company's extreme valuation multiples, with a P/E ratio of 4,771x and a price-to-book ratio of 22.82x. This raises questions about the sustainability of such high valuations in the long term.<BR><BR>In summary, Fischer Medical's latest results showcase remarkable growth and operational performance, but the high valuation multiples suggest caution for potential investors.

Read More

How has been the historical performance of Fischer Medical?

03-Nov-2025

Fischer Medical experienced significant growth from March 2024 to March 2025, with net sales rising to 110.70 Cr from 20.98 Cr, while total liabilities and assets increased to 456.98 Cr. However, profit after tax decreased slightly to 1.70 Cr, and cash flow from operating activities showed a negative trend.

Answer:<BR>The historical performance of Fischer Medical shows significant growth in various financial metrics from March 2024 to March 2025.<BR><BR>Breakdown:<BR>Fischer Medical's net sales surged to 110.70 Cr in March 2025 from 20.98 Cr in March 2024, indicating a substantial increase in total operating income, which also rose to 110.70 Cr from 20.98 Cr. The company's total expenditure, excluding depreciation, increased to 107.38 Cr from 19.12 Cr, primarily driven by a notable rise in the purchase of finished goods, which jumped to 95.28 Cr from 0.08 Cr. Operating profit (PBDIT) improved to 4.81 Cr from 2.36 Cr, while profit before tax increased to 2.71 Cr from 2.11 Cr. However, profit after tax slightly decreased to 1.70 Cr from 1.84 Cr. The consolidated net profit also fell to 1.47 Cr from 1.84 Cr, reflecting a decline in earnings per share to 0.03 from 0.34. On the balance sheet, total liabilities rose significantly to 456.98 Cr from 86.32 Cr, with total assets also increasing to 456.98 Cr from 86.32 Cr. Cash flow from operating activities showed a negative trend, with a cash outflow of 86.00 Cr in March 2025 compared to 7.00 Cr in March 2024, although cash flow from financing activities improved to 314.00 Cr from 37.00 Cr, resulting in a net cash inflow of 103.00 Cr by the end of March 2025.

Read More

Should I buy, sell or hold Fischer Medical?

04-Nov-2025

Is Fischer Medical technically bullish or bearish?

03-Dec-2025

As of December 2, 2025, Fischer Medical's technical trend is mildly bearish, supported by bearish MACD and moving averages, mixed RSI signals, and a bearish outlook from Dow Theory.

As of 2 December 2025, the technical trend for Fischer Medical has changed from sideways to mildly bearish. The current technical stance is mildly bearish, driven by several key indicators. The MACD is bearish on the weekly and mildly bearish on the monthly, while the moving averages indicate a bearish trend on the daily. Bollinger Bands and KST also reflect a mildly bearish stance on both the weekly and monthly time frames. Although the RSI shows a bullish signal on the monthly, it has no signal on the weekly, indicating mixed momentum. The Dow Theory suggests a mildly bearish outlook on the weekly, with no trend on the monthly. Overall, the combination of these indicators supports a mildly bearish view.

Read More

Why is Fischer Medical falling/rising?

04-Dec-2025

As of 04-Dec, Fischer Medical Ventures Ltd's stock price is falling, currently at 46.77, reflecting a decrease of 2.89%. The stock has underperformed recently, with declining investor interest and trading below key moving averages, indicating a downward trend.

As of 04-Dec, Fischer Medical Ventures Ltd's stock price is falling, currently at 46.77, which reflects a decrease of 1.39 or 2.89%. The stock has been underperforming, having lost 5.84% over the last two days and is trading below its moving averages across various time frames, including the 5-day, 20-day, 50-day, 100-day, and 200-day averages. <BR><BR>Investor participation has also declined significantly, with delivery volume dropping by 68.8% compared to the 5-day average, indicating reduced interest from investors. Additionally, the stock's performance today has underperformed its sector by 2.68%. <BR><BR>Despite some positive factors, such as a low debt-to-equity ratio and impressive growth in net sales and profits in recent quarters, these have not been sufficient to counteract the current downward trend in the stock price. Overall, the combination of consecutive price falls, low trading volumes, and underperformance relative to benchmarks suggests that the stock is experiencing a decline.

Read More
iScoreScore
Click here to find our call on this stock
Strong Sell
Sell
Hold
Buy
Strong Buy

MarketsMojo — Loved in India, Now Global

The power of Mojo is now in 29 countries. Explore global equities with the same cutting-edge features you love.

Dashboard
1

Poor Management Efficiency with a low ROE of 1.39%

  • The company has been able to generate a Return on Equity (avg) of 1.39% signifying low profitability per unit of shareholders funds
2

Company has a low Debt to Equity ratio (avg) at 0 times

 
3

With a growth in Net Sales of 268.22%, the company declared Outstanding results in Sep 25

4

With ROE of 0.4, it has a Very Expensive valuation with a 8.4 Price to Book Value

5

Despite the size of the company, domestic mutual funds hold only 0% of the company
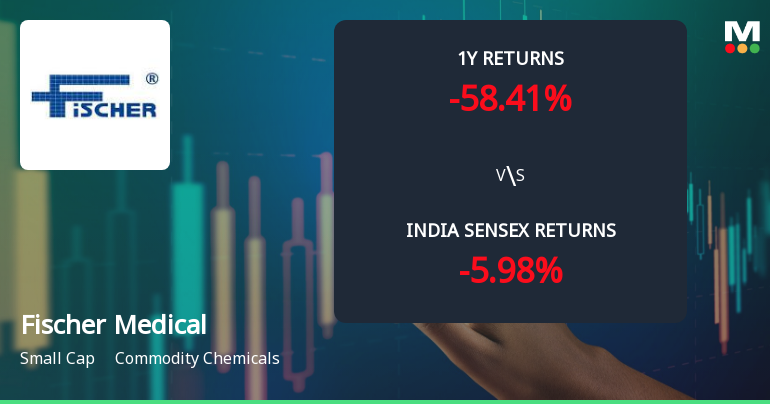
stock-summaryMojo Parameters
Mojo Parameters
Loading Valuation Snapshot...
Stock DNA
stock-summary
Industry

Commodity Chemicals

stock-summary
Market cap

INR 3,078 Cr (Small Cap)

stock-summary
P/E

2,063.00

stock-summary
Industry P/E

40

stock-summary
Dividend Yield

0.00%

stock-summary
Debt Equity

-0.04

stock-summary
Return on Equity

0.41%

stock-summary
Price to Book

8.74

Revenue and Profits:
Net Sales:
86 Cr
(Quarterly Results - Sep 2025)
Net Profit:
14 Cr
stock-summaryTotal Returns
Total Returns (Price + Dividend) stock-summary
Dividend Yield (0%)
TimePeriod
Price Return
Dividend Return
Total Return
3 Months
-57.14%
0.00%
-57.14%
6 Months
-45.98%
0.00%
-45.98%
1 Year
-25.88%
0.00%
-25.88%
2 Years
270.16%
0.00%
270.16%
3 Years
551.85%
0.00%
551.85%
4 Years
499.62%
0.00%
499.62%
5 Years
1317.27%
0.00%
1317.27%

Latest dividend: 0 per share ex-dividend date: Sep-22-2025

Risk Adjusted Returns v/s stock-summary
Returns Beta
Icon
Beta has not been calculated since enough price history is not available
stock-summaryNews & Corporate Actions
News

Is Fischer Medical technically bullish or bearish?

Recent Price Movements and Volatility

As of the latest trading session, Fischer Medical's share price closed at ₹49.67, marking a modest increase from the previous close of ₹48.37. The stock traded within a range of ₹47.00 to ₹50.26 during the day, reflecting moderate intraday volatility. However, when viewed against its 52-week high of ₹124.20 and a low of ₹40.95, the current price level remains significantly depressed, indicating a substantial retracement from its peak over the past year.

Technical Indicators Paint a Mixed Picture

The technical landscape for Fischer Medical is nuanced, with several key indicators signalling bearish tendencies, while others offer a glimmer of bullish potential. The Moving Average Convergence Divergence (MACD) s...

Read More
Announcements stock-summary

Shareholder Meeting / Postal Ballot-Scrutinizers Report

02-Dec-2025 | Source : BSE

Scrutinizers report with Voting results enclosed

Announcement under Regulation 30 (LODR)-Press Release / Media Release

01-Dec-2025 | Source : BSE

Time Medical Ventures International Ventures (India) P ltd WOS of the Company enters Indonesia through TB Eradication partnership with City of Jember

Clarification On Spurt On Volume

24-Nov-2025 | Source : BSE

Clarification on spurt on Volume

Corporate Actions stock-summary
stock-summary
BOARD MEETING

No Upcoming Board Meetings

stock-summary
DIVIDEND
stock-summary
SPLITS

Fischer Medical Ventures Ltd has announced 1:10 stock split, ex-date: 12 Sep 25

stock-summary
BONUS

No Bonus history available

stock-summary
RIGHTS

No Rights history available

stock-summaryKey Factors
Quality key factors stock-summary
Factor
Value
Sales Growth (5y)
427.60%
EBIT Growth (5y)
0.60%
EBIT to Interest (avg)
1.69
Debt to EBITDA (avg)
9.13
Net Debt to Equity (avg)
-0.04
Sales to Capital Employed (avg)
0.27
Tax Ratio
37.27%
Dividend Payout Ratio
0
Pledged Shares
0
Institutional Holding
6.99%
ROCE (avg)
1.92%
ROE (avg)
1.39%
Valuation key factors
Factor
Value
P/E Ratio
2063
Industry P/E
40
Price to Book Value
8.43
EV to EBIT
1787.28
EV to EBITDA
909.79
EV to Capital Employed
8.70
EV to Sales
27.29
PEG Ratio
NA
Dividend Yield
NA
ROCE (Latest)
0.49%
ROE (Latest)
0.41%
Technicals key factors
Indicator
Weekly
Monthly
MACD
Bearish
Mildly Bearish
RSI
No Signal
Bullish
Bollinger Bands
Bearish
Bearish
Moving Averages
Bearish (Daily)
KST
Bearish
Mildly Bearish
Dow Theory
Mildly Bearish
No Trend
OBV
Bullish
Bullish
stock-summary Technical Indicator Scale: Bearish, Mildly Bearish, Sideways, Mildly Bullish, Bullish  Turned 
stock-summaryShareholding
Shareholding Snapshot : Sep 2025stock-summary
Shareholding Compare (%holding) stock-summary
Majority shareholders

Promoters

Pledged Promoter Holdings

None

Mutual Funds

Held by 2 Schemes (0.0%)

FIIs

Held by 7 FIIs (5.57%)

Promoter with highest holding

Fmv Holdings Pte Ltd (51.16%)

Highest Public shareholder

Roopal Hitesh Kawa (2.74%)

Individual Investors Holdings

26.29%

stock-summaryFinancial
[
  {
    "link": "quarterly",
    "btn_text": "All Quarterly Results",
    "header": "Quarterly Results Snapshot (Consolidated) - Sep'25 - QoQ",
    "rhs": [
      {
        "prefix": "Net Sales ",
        "suffix": "QoQ Growth in quarter ended Sep 2025 is 268.22% vs -52.33% in Jun 2025",
        "dir": 1
      },
      {
        "prefix": "Consolidated Net Profit ",
        "suffix": "QoQ Growth in quarter ended Sep 2025 is 177.45% vs 282.44% in Jun 2025",
        "dir": -1
      }
    ],
    "table": {
      "header": [
        "Sep'25",
        "Jun'25",
        "Change(%)"
      ],
      "body": [
        {
          "field": "Net Sales",
          "val1": "86.31",
          "val2": "23.44",
          "chgp": "268.22%",
          "chgp_class": "positive"
        },
        {
          "field": "Operating Profit (PBDIT) excl Other Income",
          "val1": "16.26",
          "val2": "4.26",
          "chgp": "281.69%",
          "chgp_class": "positive"
        },
        {
          "field": "Interest",
          "val1": "0.92",
          "val2": "0.67",
          "chgp": "37.31%",
          "chgp_class": "negative"
        },
        {
          "field": "Exceptional Items",
          "val1": "-0.04",
          "val2": "-0.11",
          "chgp": "63.64%",
          "chgp_class": "positive"
        },
        {
          "field": "Consolidate Net Profit",
          "val1": "13.90",
          "val2": "5.01",
          "chgp": "177.45%",
          "chgp_class": "positive"
        },
        {
          "field": "Operating Profit Margin (Excl OI)",
          "val1": "18.84%",
          "val2": "18.17%",
          "chgp": "0.67%",
          "chgp_class": "positive"
        }
      ]
    }
  },
  {
    "link": "half-yearly",
    "btn_text": "All Half Yearly Results",
    "header": "Half Yearly Results Snapshot (Consolidated) - Sep'25",
    "rhs": [
      {
        "prefix": "Net Sales ",
        "suffix": " Growth in half year ended Sep 2025 is 120.47% vs 0.00% in Sep 2024",
        "dir": 1
      },
      {
        "prefix": "Consolidated Net Profit ",
        "suffix": " Growth in half year ended Sep 2025 is 10,400.00% vs 0.00% in Sep 2024",
        "dir": 1
      }
    ],
    "table": {
      "header": [
        "Sep'25",
        "Sep'24",
        "Change(%)"
      ],
      "body": [
        {
          "field": "Net Sales",
          "val1": "109.75",
          "val2": "49.78",
          "chgp": "120.47%",
          "chgp_class": "positive"
        },
        {
          "field": "Operating Profit (PBDIT) excl Other Income",
          "val1": "20.51",
          "val2": "0.33",
          "chgp": "6,115.15%",
          "chgp_class": "positive"
        },
        {
          "field": "Interest",
          "val1": "1.59",
          "val2": "0.17",
          "chgp": "835.29%",
          "chgp_class": "negative"
        },
        {
          "field": "Exceptional Items",
          "val1": "-0.15",
          "val2": "-0.26",
          "chgp": "42.31%",
          "chgp_class": "positive"
        },
        {
          "field": "Consolidate Net Profit",
          "val1": "18.90",
          "val2": "0.18",
          "chgp": "10,400.00%",
          "chgp_class": "positive"
        },
        {
          "field": "Operating Profit Margin (Excl OI)",
          "val1": "18.69%",
          "val2": "0.66%",
          "chgp": "18.03%",
          "chgp_class": "positive"
        }
      ]
    }
  },
  {
    "link": "nine-monthly",
    "btn_text": "All Nine Monthly Results",
    "header": "Nine Monthly Results Snapshot (Standalone) - Dec'24",
    "rhs": [
      {
        "prefix": "Net Sales ",
        "suffix": "YoY Growth in nine months ended Dec 2024 is -100.00% vs 0.00% in Dec 2023",
        "dir": -1
      },
      {
        "prefix": "Standalone Net Profit ",
        "suffix": "YoY Growth in nine months ended Dec 2024 is 1,650.00% vs 33.33% in Dec 2023",
        "dir": 1
      }
    ],
    "table": {
      "header": [
        "Dec'24",
        "Dec'23",
        "Change(%)"
      ],
      "body": [
        {
          "field": "Net Sales",
          "val1": "0.00",
          "val2": "0.19",
          "chgp": "-100.00%",
          "chgp_class": "negative"
        },
        {
          "field": "Operating Profit (PBDIT) excl Other Income",
          "val1": "-0.68",
          "val2": "-0.07",
          "chgp": "-871.43%",
          "chgp_class": "negative"
        },
        {
          "field": "Interest",
          "val1": "0.01",
          "val2": "0.05",
          "chgp": "-80.00%",
          "chgp_class": "positive"
        },
        {
          "field": "Exceptional Items",
          "val1": "0.00",
          "val2": "0.00",
          "chgp": "",
          "chgp_class": "neutral"
        },
        {
          "field": "Standalone Net Profit",
          "val1": "1.55",
          "val2": "-0.10",
          "chgp": "1,650.00%",
          "chgp_class": "positive"
        },
        {
          "field": "Operating Profit Margin (Excl OI)",
          "val1": "0.00%",
          "val2": "-36.84%",
          "chgp": "36.84%",
          "chgp_class": "positive"
        }
      ]
    }
  },
  {
    "link": "annual",
    "btn_text": "All Annual Results",
    "header": "Annual Results Snapshot (Standalone) - Mar'25",
    "rhs": [
      {
        "prefix": "Net Sales ",
        "suffix": "YoY Growth in year ended Mar 2025 is -54.73% vs 6,305.56% in Mar 2024",
        "dir": -1
      },
      {
        "prefix": "Standalone Net Profit ",
        "suffix": "YoY Growth in year ended Mar 2025 is 65.00% vs 1,100.00% in Mar 2024",
        "dir": -1
      }
    ],
    "table": {
      "header": [
        "Mar'25",
        "Mar'24",
        "Change(%)"
      ],
      "body": [
        {
          "field": "Net Sales",
          "val1": "5.22",
          "val2": "11.53",
          "chgp": "-54.73%",
          "chgp_class": "negative"
        },
        {
          "field": "Operating Profit (PBDIT) excl Other Income",
          "val1": "-2.23",
          "val2": "-0.19",
          "chgp": "-1,073.68%",
          "chgp_class": "negative"
        },
        {
          "field": "Interest",
          "val1": "0.13",
          "val2": "0.02",
          "chgp": "550.00%",
          "chgp_class": "negative"
        },
        {
          "field": "Exceptional Items",
          "val1": "0.00",
          "val2": "0.00",
          "chgp": "",
          "chgp_class": "neutral"
        },
        {
          "field": "Standalone Net Profit",
          "val1": "0.66",
          "val2": "0.40",
          "chgp": "65.00%",
          "chgp_class": "positive"
        },
        {
          "field": "Operating Profit Margin (Excl OI)",
          "val1": "-42.72%",
          "val2": "-1.65%",
          "chgp": "-41.07%",
          "chgp_class": "negative"
        }
      ]
    }
  }
]
Quarterly Results Snapshot (Consolidated) - Sep'25 - QoQstock-summary
Sep'25
Jun'25
Change(%)
Net Sales
86.31
23.44
268.22%
Operating Profit (PBDIT) excl Other Income
16.26
4.26
281.69%
Interest
0.92
0.67
37.31%
Exceptional Items
-0.04
-0.11
63.64%
Consolidate Net Profit
13.90
5.01
177.45%
Operating Profit Margin (Excl OI)
18.84%
18.17%
0.67%
Values in Rs Cr.
Direction Arrows
Net Sales

QoQ Growth in quarter ended Sep 2025 is 268.22% vs -52.33% in Jun 2025

Direction Arrows
Consolidated Net Profit

QoQ Growth in quarter ended Sep 2025 is 177.45% vs 282.44% in Jun 2025

Half Yearly Results Snapshot (Consolidated) - Sep'25stock-summary
Sep'25
Sep'24
Change(%)
Net Sales
109.75
49.78
120.47%
Operating Profit (PBDIT) excl Other Income
20.51
0.33
6,115.15%
Interest
1.59
0.17
835.29%
Exceptional Items
-0.15
-0.26
42.31%
Consolidate Net Profit
18.90
0.18
10,400.00%
Operating Profit Margin (Excl OI)
18.69%
0.66%
18.03%
Values in Rs Cr.
Direction Arrows
Net Sales

Growth in half year ended Sep 2025 is 120.47% vs 0.00% in Sep 2024

Direction Arrows
Consolidated Net Profit

Growth in half year ended Sep 2025 is 10,400.00% vs 0.00% in Sep 2024

Nine Monthly Results Snapshot (Standalone) - Dec'24stock-summary
Dec'24
Dec'23
Change(%)
Net Sales
0.00
0.19
-100.00%
Operating Profit (PBDIT) excl Other Income
-0.68
-0.07
-871.43%
Interest
0.01
0.05
-80.00%
Exceptional Items
0.00
0.00
Standalone Net Profit
1.55
-0.10
1,650.00%
Operating Profit Margin (Excl OI)
0.00%
-36.84%
36.84%
Values in Rs Cr.
Direction Arrows
Net Sales

YoY Growth in nine months ended Dec 2024 is -100.00% vs 0.00% in Dec 2023

Direction Arrows
Standalone Net Profit

YoY Growth in nine months ended Dec 2024 is 1,650.00% vs 33.33% in Dec 2023

Annual Results Snapshot (Standalone) - Mar'25stock-summary
Mar'25
Mar'24
Change(%)
Net Sales
5.22
11.53
-54.73%
Operating Profit (PBDIT) excl Other Income
-2.23
-0.19
-1,073.68%
Interest
0.13
0.02
550.00%
Exceptional Items
0.00
0.00
Standalone Net Profit
0.66
0.40
65.00%
Operating Profit Margin (Excl OI)
-42.72%
-1.65%
-41.07%
Values in Rs Cr.
Direction Arrows
Net Sales

YoY Growth in year ended Mar 2025 is -54.73% vs 6,305.56% in Mar 2024

Direction Arrows
Standalone Net Profit

YoY Growth in year ended Mar 2025 is 65.00% vs 1,100.00% in Mar 2024

stock-summaryCompany CV
About Fischer Medical Ventures Ltd stock-summary
stock-summary
Fischer Medical Ventures Ltd
Small Cap
Commodity Chemicals
Fischer Medical Ventures Limited is emerging as a leading player in the trading of MRI systems. Headquartered in the Andhra Pradesh MedTech Zone (AMTZ) in Vishakhapatnam, India, Company is pioneering the development of advanced, affordable, and accessible medical diagnostic and imaging technologies, through its wholly owned subsidiary. In partnership with the wholly owned subsidiary, it has established a significant international footprint, operating across multiple continents and key markets.
Company Coordinates stock-summary
Company Details
104 1st Fl Bhhind Poisar Depot, Raghuleela Mall Kandivali (W) Mumbai Maharashtra : 400067
stock-summary
Tel:
stock-summary
fischerchemicltd@gmail.com
Registrar Details
Adroit Corporate Services Pvt Ltd, 17-20 Jaferbhoy Industrial Estate , 1st Floor, Makwana Road, Marol Naka, Mumbai