
Compare Flex Foods with Similar Stocks
Dashboard
With HIgh Debt (Debt-Equity Ratio at 33.14 times)- the company has a Weak Long Term Fundamental Strength
- The company has been able to generate a Return on Equity (avg) of 9.49% signifying low profitability per unit of shareholders funds
Risky - Negative Operating Profits
Below par performance in long term as well as near term
Stock DNA
Other Agricultural Products
INR 54 Cr (Micro Cap)
NA (Loss Making)
46
1.15%
33.14
-344.79%
5.87
Total Returns (Price + Dividend) 
Latest dividend: 0.5 per share ex-dividend date: Jul-25-2025
Risk Adjusted Returns v/s
Returns Beta

News

Flex Foods Ltd is Rated Strong Sell
Flex Foods Ltd is rated Strong Sell by MarketsMOJO, with this rating last updated on 29 June 2026. However, the analysis and financial metrics discussed here reflect the stock’s current position as of 14 July 2026, providing investors with the most up-to-date view of the company’s fundamentals, valuation, financial trends, and technical outlook.
Read full news article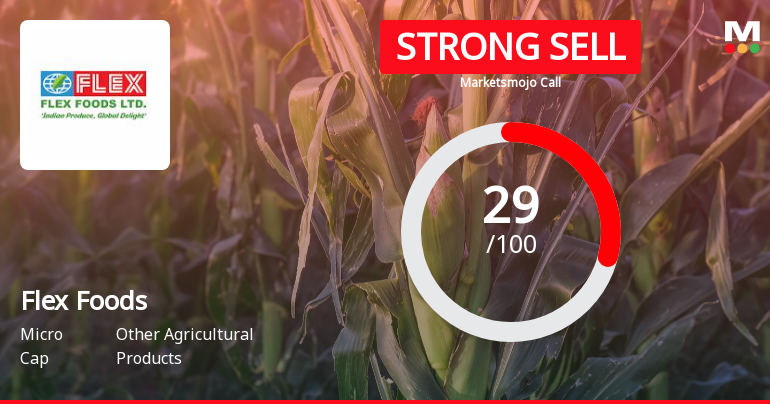
Flex Foods Ltd Downgraded to Strong Sell Amid Technical and Fundamental Concerns
Flex Foods Ltd has seen its investment rating downgraded from Sell to Strong Sell, reflecting a combination of deteriorating technical indicators, challenging financial fundamentals, and valuation concerns. The micro-cap company, operating in the Other Agricultural Products sector, faces significant headwinds despite recent sales growth, prompting a reassessment of its outlook by market analysts.
Read full news article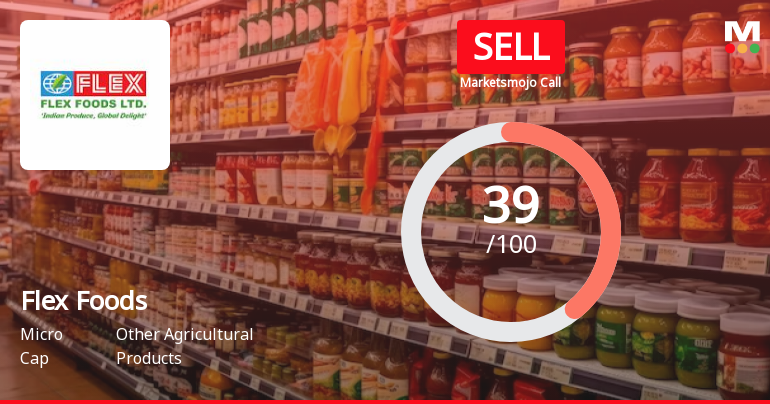
Flex Foods Ltd is Rated Sell by MarketsMOJO
Flex Foods Ltd is rated 'Sell' by MarketsMOJO, with this rating last updated on 16 June 2026. However, the analysis and financial metrics discussed below reflect the stock’s current position as of 29 June 2026, providing investors with an up-to-date view of the company’s fundamentals, valuation, financial trends, and technical outlook.
Read full news article Announcements
Shareholder Meeting / Postal Ballot-Outcome of AGM
16-Jul-2026 | Source : BSEProceedings of the 36th Annual General Meeting held on 16th July 2026.
Shareholder Meeting / Postal Ballot-Scrutinizers Report
16-Jul-2026 | Source : BSESubmission of Scrutinizers Report
Regulation 44(3) Of SEBI (LODR) Regulations 2015 - Voting Results Of 36Th Annual General Meeting
16-Jul-2026 | Source : BSERegulation 44(3) of SEBI (LODR) Regulations 2015 - Voting Results of 36th Annual General Meeting
Corporate Actions

No Upcoming Board Meetings

Flex Foods Ltd has declared 5% dividend, ex-date: 25 Jul 25

No Splits history available

No Bonus history available

No Rights history available
Quality key factors
Valuation key factors
Technicals key factors
 Technical Indicator Scale: Bearish, Mildly Bearish, Sideways, Mildly Bullish, Bullish Turned
 Shareholding Snapshot : Mar 2026
Shareholding Compare (%holding)
Promoters
None
Held by 0 Schemes
Held by 0 FIIs
Uflex Limited (47.15%)
Santosh Sitaram Goenka (1.93%)
31.35%
Quarterly Results Snapshot (Standalone) - Mar'26 - QoQ

QoQ Growth in quarter ended Mar 2026 is 22.58% vs -6.63% in Dec 2025
QoQ Growth in quarter ended Mar 2026 is 68.32% vs 7.31% in Dec 2025
Half Yearly Results Snapshot (Standalone) - Sep'25

Growth in half year ended Sep 2025 is 17.38% vs 56.54% in Sep 2024
Growth in half year ended Sep 2025 is -9.39% vs -109.40% in Sep 2024
Nine Monthly Results Snapshot (Standalone) - Dec'25
YoY Growth in nine months ended Dec 2025 is 29.70% vs 36.29% in Dec 2024
YoY Growth in nine months ended Dec 2025 is -7.48% vs -12.74% in Dec 2024
Annual Results Snapshot (Standalone) - Mar'26
YoY Growth in year ended Mar 2026 is 27.89% vs 23.83% in Mar 2025
YoY Growth in year ended Mar 2026 is 2.18% vs -25.34% in Mar 2025
About Flex Foods Ltd

Company Coordinates


