
Compare Flexituff Vent. with Similar Stocks
Dashboard
With a Negative Book Value, the company has a Weak Long Term Fundamental Strength
- Low ability to service debt as the company has a high Debt to EBITDA ratio of -9.04 times
- The company has been able to generate a Return on Equity (avg) of 0.62% signifying low profitability per unit of shareholders funds
The company has declared Negative results for the last 15 consecutive quarters
Risky - Negative EBITDA
77% of Promoter Shares are Pledged
Below par performance in long term as well as near term
Stock DNA
Garments & Apparels
INR 16 Cr (Micro Cap)
NA (Loss Making)
21
0.00%
-2.17
110.90%
-0.14
Total Returns (Price + Dividend) 
Latest dividend: 1 per share ex-dividend date: Sep-21-2015
Risk Adjusted Returns v/s
Returns Beta

News
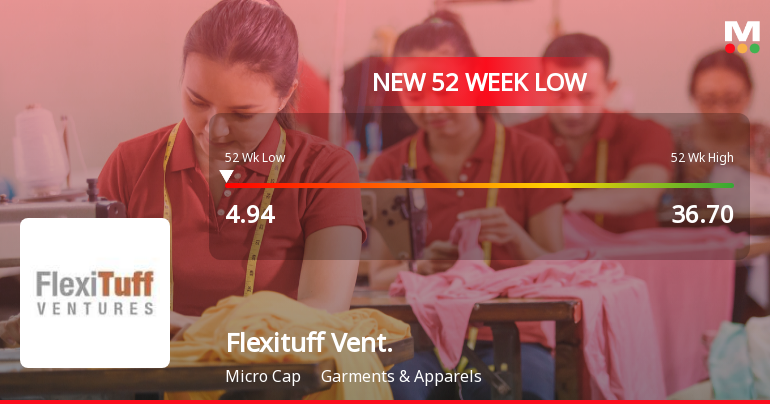

Five Consecutive Losses Push Flexituff Ventures International Ltd to a New 52-Week Low
For the fifth straight session, Flexituff Ventures International Ltd closed lower, breaching its 52-week low at Rs 5.04 on 14 Jul 2026, marking a steep decline of 85.97% over the past year.
Read full news article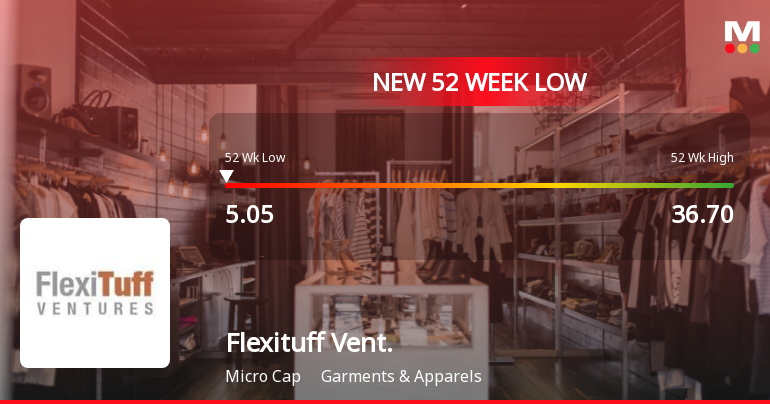
Five Consecutive Losses Push Flexituff Ventures International Ltd to a New 52-Week Low
For the fifth consecutive session, Flexituff Ventures International Ltd has closed lower, slipping to a fresh 52-week low of Rs 5.05 on 13 Jul 2026. This marks a steep decline of 86.24% over the past year, sharply underperforming the Sensex's modest fall of 6.44% in the same period.
Read full news article Announcements
Compliances-Certificate under Reg. 74 (5) of SEBI (DP) Regulations 2018
14-Jul-2026 | Source : BSEFlexituff Ventures International Limited hereby submits Certificate under Regulation 74(5) of SEBI (Depository and Participants) Regulations 2018
Compliances-Certificate under Reg. 74 (5) of SEBI (DP) Regulations 2018
14-Jul-2026 | Source : BSEFlexituff Ventures International Limited hereby submits Certificate under Regulation 74(5) of SEBI (Depository and Participants) Regulations 2018
Closure of Trading Window
26-Jun-2026 | Source : BSEFlexituff Ventures International Limited has informed the Exchange regarding Trading Window Closure for the Quarter Ended 30th June 2026 pursuant to SEBI (Prohibition of Insider Trading) Regulation 2015.
Corporate Actions

No Upcoming Board Meetings

Flexituff Ventures International Ltd has declared 10% dividend, ex-date: 21 Sep 15

No Splits history available

No Bonus history available

No Rights history available
Quality key factors
Valuation key factors
Technicals key factors
 Technical Indicator Scale: Bearish, Mildly Bearish, Sideways, Mildly Bullish, Bullish Turned
 Shareholding Snapshot : Mar 2026
Shareholding Compare (%holding)
Non Institution
76.9975
Held by 0 Schemes
Held by 0 FIIs
Kalani Industries Private Limited (11.03%)
International Finance Corporation (5.8%)
24.69%
Quarterly Results Snapshot (Consolidated) - Mar'26 - YoY

YoY Growth in quarter ended Mar 2026 is -99.55% vs -46.50% in Mar 2025
YoY Growth in quarter ended Mar 2026 is -498.70% vs 81.80% in Mar 2025
Half Yearly Results Snapshot (Consolidated) - Sep'25
Growth in half year ended Sep 2025 is -89.82% vs -51.20% in Sep 2024
Growth in half year ended Sep 2025 is -113.73% vs 502.58% in Sep 2024
Nine Monthly Results Snapshot (Consolidated) - Dec'25
YoY Growth in nine months ended Dec 2025 is -92.75% vs -53.02% in Dec 2024
YoY Growth in nine months ended Dec 2025 is -126.35% vs 307.83% in Dec 2024
Annual Results Snapshot (Consolidated) - Mar'26
YoY Growth in year ended Mar 2026 is -94.18% vs -51.79% in Mar 2025
YoY Growth in year ended Mar 2026 is -156.78% vs 229.57% in Mar 2025
About Flexituff Ventures International Ltd

Company Coordinates


