
Compare Foods & Inns with Similar Stocks
Total Returns (Price + Dividend) 
Latest dividend: 0.3 per share ex-dividend date: Sep-15-2025
Risk Adjusted Returns v/s
Returns Beta

News
Foods & Inns Ltd is Rated Sell by MarketsMOJO
Foods & Inns Ltd is rated Sell by MarketsMOJO, with this rating last updated on 19 August 2025. However, the analysis and financial metrics presented here reflect the stock's current position as of 21 June 2026, providing investors with an up-to-date view of the company’s fundamentals, returns, and market performance.
Read full news article
Foods & Inns Ltd is Rated Sell by MarketsMOJO
Foods & Inns Ltd is rated Sell by MarketsMOJO, with this rating last updated on 19 Aug 2025. However, the analysis and financial metrics discussed here reflect the stock's current position as of 10 June 2026, providing investors with an up-to-date view of the company’s fundamentals, returns, and market performance.
Read full news article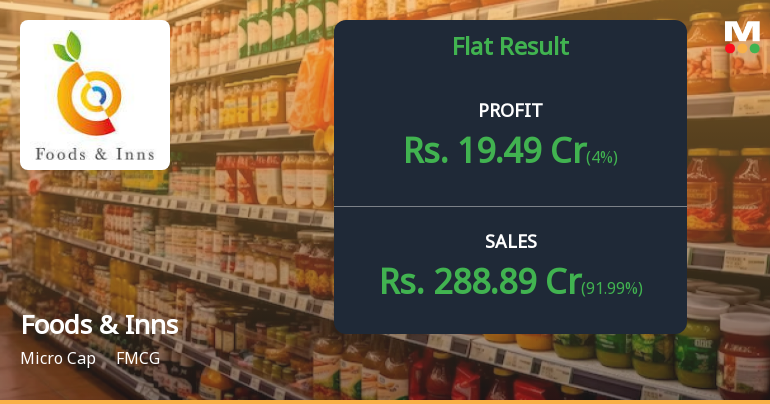
Foods & Inns Q4 FY26: Strong Quarter Masks Underlying Weakness
Foods & Inns Ltd., a micro-cap processed foods manufacturer with a market capitalisation of ₹409.00 crores, reported a dramatic turnaround in Q4 FY26 with consolidated net profit surging to ₹19.49 crores, representing a staggering quarter-on-quarter growth of 4,432.56% from the meagre ₹0.43 crores posted in Q3 FY26. However, the year-on-year comparison reveals a concerning 16.42% decline from ₹23.32 crores in Q4 FY25, highlighting the volatility that has characterised the company's recent performance.
Read full news article Announcements
Corporate Actions

No Upcoming Board Meetings

Foods & Inns Ltd has declared 30% dividend, ex-date: 15 Sep 25

Foods & Inns Ltd has announced 1:10 stock split, ex-date: 19 Apr 18

Foods & Inns Ltd has announced 2:1 bonus issue, ex-date: 30 Apr 19

No Rights history available
Quality key factors
Valuation key factors
Technicals key factors
 Technical Indicator Scale: Bearish, Mildly Bearish, Sideways, Mildly Bullish, Bullish Turned
 Shareholding Snapshot : Mar 2026
Shareholding Compare (%holding)
Non Institution
9.2561
Held by 0 Schemes
Held by 3 FIIs (0.11%)
Raymond Simkins (8.75%)
Barclays Wealth Trustees India Pvt Ltd (12.26%)
32.76%
Quarterly Results Snapshot (Consolidated) - Mar'26 - QoQ

QoQ Growth in quarter ended Mar 2026 is 91.99% vs -21.84% in Dec 2025
QoQ Growth in quarter ended Mar 2026 is 4,432.56% vs -35.82% in Dec 2025
Half Yearly Results Snapshot (Consolidated) - Sep'25
Growth in half year ended Sep 2025 is 3.05% vs -20.80% in Sep 2024

Growth in half year ended Sep 2025 is -57.31% vs -34.51% in Sep 2024
Nine Monthly Results Snapshot (Consolidated) - Dec'25
YoY Growth in nine months ended Dec 2025 is -4.34% vs -10.32% in Dec 2024
YoY Growth in nine months ended Dec 2025 is -56.82% vs -39.79% in Dec 2024
Annual Results Snapshot (Consolidated) - Mar'26
YoY Growth in year ended Mar 2026 is -12.51% vs -2.75% in Mar 2025
YoY Growth in year ended Mar 2026 is -34.55% vs 15.22% in Mar 2025
About Foods & Inns Ltd

Company Coordinates


