Fortis Health.

INR
904.50
-7.4 (-0.81%)
BSENSE

Sep 10, 11:16 AM

BSE+NSE Vol: 3.35 lacs

  • Price Points
  • Score
  • Mojo Parameters
  • Total Return
  • News and Corporate Actions
  • Key factors
  • Shareholding
  • Financials
  • CompanyCV
stock-summaryPrice Point
High/Low

1Day

52 Week

Valuation
Technical
Day's Volume

CASH

3.35 lacs (36.84%) Volume

Shareholding (Jun 2026)

FII

25.20%

Held by 628 FIIs

DII

32.23%

Held by 88 DIIs

Promoter

31.17%

Why is Fortis Healthcare Ltd falling/rising?

06-Sep-2026

As of 05-Sep, Fortis Healthcare Ltd's stock price is at 910.00, down 0.29%. The stock has been declining recently, underperforming benchmarks, but shows resilience year-to-date with a 2.99% gain and strong debt servicing capabilities.

As of 05-Sep, Fortis Healthcare Ltd's stock price is currently at 910.00, reflecting a decrease of 2.65 (-0.29%). The stock has been on a downward trend, having fallen for the last two days, resulting in a total decline of -0.42% during this period. Additionally, the stock is trading below its 5-day, 20-day, 50-day, 100-day, and 200-day moving averages, indicating a bearish sentiment among investors.<BR><BR>In terms of performance relative to the benchmark, the stock has underperformed over the past week and month, with declines of -2.15% and -2.67%, respectively. However, it has shown resilience year-to-date with a gain of +2.99%, contrasting with the Sensex's decline of -10.21% during the same period. <BR><BR>Despite the recent price drop, there are positive factors to consider, such as the company's strong ability to service debt, evidenced by a low Debt to EBITDA ratio of 1.67 times, and healthy long-term growth with an annual operating profit growth rate of 27.61%. Furthermore, there has been a rise in investor participation, with a delivery volume increase of 3.95% against the 5-day average, suggesting some level of interest in the stock despite its current decline.

View full answer

Who are in the management team of Fortis Health.?

01-Sep-2026

The management team of Fortis Health includes Chairman Ravi Rajagopal, CEO Ashutosh Raghuvanshi, and several independent and non-executive directors, along with Company Secretary Murlee Manohar Jain, bringing diverse expertise to the company's governance and strategy.

The management team of Fortis Health includes the following members:<BR><BR>1. **Ravi Rajagopal** - Chairman & Independent Director<BR>2. **Ashutosh Raghuvanshi** - Managing Director & CEO<BR>3. **Suvalaxmi Chakraborty** - Independent Director<BR>4. **Indrajit Banerjee** - Independent Director<BR>5. **Shailaja Chandra** - Independent Director<BR>6. **DILIP KADAMBI** - Non Executive Director<BR>7. **Sim Heng Joo Joe** - Non Executive Director<BR>8. **Joerg Ayrla** - Non Executive Director<BR>9. **Tomo Nagahiro** - Non Executive Director<BR>10. **Mehmet Ali Aydinlar** - Non Executive Director<BR>11. **Lim Tsin Lin** - Non Executive Director<BR>12. **Murlee Manohar Jain** - Company Secretary & Compliance Officer<BR><BR>This diverse team brings a range of expertise to the company, contributing to its governance and strategic direction.

View full answer

What does Fortis Health. do?

01-Sep-2026

Fortis Healthcare Ltd is a leading healthcare services provider in India, operating 36 hospitals and over 400 diagnostics centers, with a market cap of INR 68,599 Cr. As of June 2026, it reported net sales of 2,545 Cr and a net profit of 266 Cr.

Overview: <BR>Fortis Healthcare Ltd is one of the largest healthcare services providers in India, operating in the hospital industry within the mid-cap market segment.<BR><BR>History: <BR>Fortis Healthcare Ltd was incorporated in an unspecified year and has grown to include 36 hospitals and over 400 diagnostics centers. The latest quarterly results reported net sales and net profit for June 2026.<BR><BR>Financial Snapshot: <BR>- Net Sales: 2,545 Cr (Quarterly Results - Jun 2026) <BR>- Net Profit: 266 Cr (Quarterly Results - Jun 2026) <BR>- Market Cap: INR 68,599 Cr (Mid Cap) <BR><BR>Key Metrics: <BR>- P/E: 64.00 <BR>- Industry P/E: 67 <BR>- Dividend Yield: 0.11% <BR>- Debt Equity: 0.29 <BR>- Return on Equity: 10.70% <BR>- Price to Book: 7.10 <BR><BR>Contact Details: <BR>Address: Fortis Hospital Sector-62, Phase-VIII Mohali Punjab : 160062 <BR>Tel: 91-172-5096001 <BR>Email: secretarial@fortishealthcare.com <BR>Website: http://www.fortishealthcare.com

View full answer

Who are the peers of the Fortis Health.?

01-Sep-2026

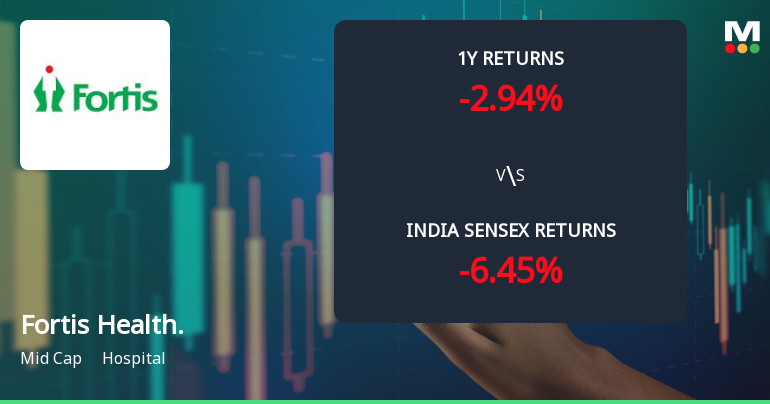
Fortis Health's peers include Apollo Hospitals, Max Healthcare, Aster DM Quality, Global Health, Narayana Hrudaya, Krishna Institute, Dr. Agarwal's Health, and Rainbow Child. In terms of management risk and growth, Fortis Health has average ratings, with a 1-year return of -0.39%, better than Max Healthcare's -11.72% but worse than Aster DM Quality's 25.77%.

Peers: The peers of Fortis Health are Apollo Hospitals, Max Healthcare, Aster DM Quality, Global Health, Narayana Hrudaya, Krishna Institu., Dr Agarwal's Hea, and Rainbow Child.<BR><BR>Quality Snapshot: Excellent management risk is observed at Apollo Hospitals, Narayana Hrudaya, Global Health, and the rest. Good management risk is found at Aster DM Quality, Krishna Institu., and Rainbow Child, while Average management risk is present at Max Healthcare, Fortis Health., and Dr Agarwal's Hea. Excellent growth is noted at Apollo Hospitals and Narayana Hrudaya, while Good growth is seen at Fortis Health., Dr Agarwal's Hea, and the rest. Below Average growth is observed at Aster DM Quality and Krishna Institu., while Average growth is found at Global Health. Average capital structure is noted at Aster DM Quality and Fortis Health., while Good capital structure is present at Max Healthcare, Narayana Hrudaya, Krishna Institu., Dr Agarwal's Hea, and Rainbow Child. Excellent capital structure is observed at Global Health.<BR><BR>Return Snapshot: The peer with the highest 1-year return is Aster DM Quality at 25.77%, while Max Healthcare has the lowest at -11.72%. Fortis Health.'s 1-year return is -0.39%, which is better than Max Healthcare's but worse than Aster DM Quality's. Additionally, Max Healthcare and Rainbow Child have negative six-month returns.

View full answer

How big is Fortis Health.?

01-Sep-2026

As of 31st August, Fortis Healthcare Ltd has a market capitalization of 68,599.00 Cr, with net sales of 9,506.15 Cr and a net profit of 1,047.89 Cr reported in the latest four quarters.

As of 31st August, Fortis Healthcare Ltd has a market capitalization of 68,599.00 Cr, categorizing it as a Mid Cap company.<BR><BR>In the latest four quarters, Fortis Healthcare Ltd reported net sales of 9,506.15 Cr and a net profit of 1,047.89 Cr.<BR><BR>The latest annual period for the balance sheet is March 2026, where shareholder's funds amounted to 9,895.55 Cr and total assets were valued at 15,832.84 Cr.

View full answer

Should I buy, sell or hold Fortis Healthcare Ltd?

18-Aug-2026

When is the next results date for Fortis Healthcare Ltd?

31-Jul-2026

The next results date for Fortis Healthcare Ltd is August 6, 2026.

The next results date for Fortis Healthcare Ltd is scheduled for August 6, 2026.

View full answer

Are Fortis Healthcare Ltd latest results good or bad?

23-May-2026

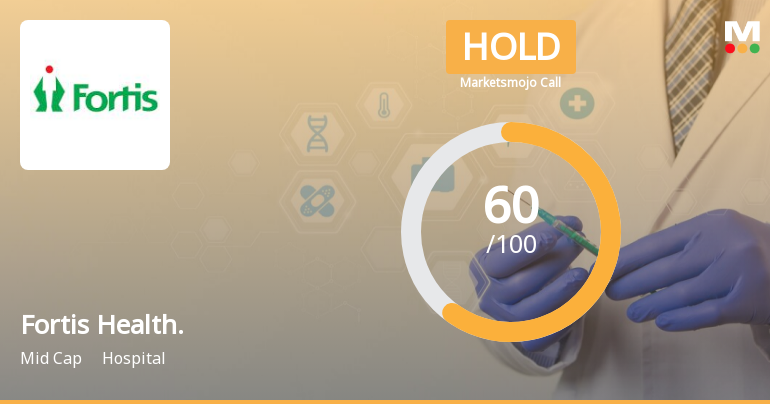
Fortis Healthcare Ltd's latest results show strong profit and revenue growth, with a net profit increase of 44.57% and record quarterly revenue. However, concerns about its high valuation and low return on equity suggest investors should be cautious, leading analysts to rate the stock as a "HOLD."

Fortis Healthcare Ltd's latest results present a mixed picture. On one hand, the company reported a strong performance in Q4 FY26, with net profit increasing by 44.57% year-on-year to ₹265.85 crores and revenue growing by 17.81% to ₹2,364.67 crores, marking the highest quarterly revenue on record. Additionally, the operating margin improved to 22.51%, reflecting better cost management.<BR><BR>However, there are concerns regarding the company's premium valuation, trading at 72x trailing earnings, which is significantly above the industry average of 63x. Analysts have rated the stock as a "HOLD," indicating caution due to its high valuation despite the strong profit growth. Furthermore, the company's return on equity (ROE) remains low at 7.20%, which is below industry standards, raising questions about its capital efficiency.<BR><BR>In summary, while Fortis Healthcare has demonstrated impressive growth in profits and revenue, the high valuation and weak return ratios suggest that investors should approach with caution. The overall sentiment is that the results are good in terms of growth, but the valuation and return metrics present challenges.

View full answer

Is Fortis Health. overvalued or undervalued?

05-Dec-2025

As of December 4, 2025, Fortis Health is considered expensive and overvalued with a PE ratio of 66.42, higher than its peers, despite a strong YTD return of 23.12% compared to the Sensex's 9.12%.

As of 4 December 2025, the valuation grade for Fortis Health has moved from very expensive to expensive. The company is currently considered overvalued based on its high valuation ratios, including a PE ratio of 66.42, an EV to EBITDA ratio of 37.50, and a Price to Book Value of 7.09. <BR><BR>In comparison to its peers, Fortis Health's PE ratio is higher than Apollo Hospitals at 61.81 and Narayana Hrudaya at 46.47, both of which are also categorized as expensive. The company's recent stock performance shows a YTD return of 23.12%, significantly outperforming the Sensex's return of 9.12% during the same period, which may indicate strong market interest despite its overvaluation.

View full answer

How has been the historical performance of Fortis Health.?

13-Nov-2025

Fortis Health has shown consistent growth in net sales and profitability, with net sales increasing from 4,469.36 Cr in March 2019 to 7,782.75 Cr in March 2025, and profit after tax improving from a loss of 588.12 Cr to a profit of 797.86 Cr during the same period. The company's financial performance reflects a positive growth trajectory with rising revenues and operating profits.

Answer:<BR>The historical performance of Fortis Health shows a consistent growth in net sales and profitability over the years, culminating in the fiscal year ending March 2025.<BR><BR>Breakdown:<BR>Fortis Health has demonstrated a steady increase in net sales, rising from 4,469.36 Cr in March 2019 to 7,782.75 Cr in March 2025. The total operating income has followed a similar upward trajectory, reaching 7,782.75 Cr in March 2025, compared to 4,469.36 Cr in March 2019. The company has also improved its operating profit (PBDIT), which increased from 317.62 Cr in March 2019 to 1,654.88 Cr in March 2025, reflecting an operating profit margin of 20.4% in the latest fiscal year. Profit before tax has shown a positive trend, moving from a loss of 474.51 Cr in March 2019 to a profit of 995.52 Cr in March 2025. Consequently, profit after tax has also improved significantly, from a loss of 588.12 Cr in March 2019 to a profit of 797.86 Cr in March 2025. The company's total assets have increased from 10,954.94 Cr in March 2020 to 13,376.98 Cr in March 2025, while total liabilities have also risen, indicating a growing business scale. Cash flow from operating activities has improved, reaching 1,423.00 Cr in March 2025, although the company experienced a net cash outflow of 69.00 Cr in the same period. Overall, Fortis Health's financial performance reflects a positive growth trajectory with increasing revenues and profitability over the years.

View full answer

How has been the historical performance of Fortis Health.?

12-Nov-2025

Fortis Health has shown consistent growth in net sales and profitability from March 2019 to March 2025, with net sales increasing from 4,469.36 Cr to 7,782.75 Cr and profit after tax rising from a loss of 588.12 Cr to 797.86 Cr. The company has demonstrated a strong recovery, with significant improvements in operating profit and cash flow during this period.

Answer:<BR>The historical performance of Fortis Health shows a consistent growth trajectory in net sales and profitability over the years, culminating in the fiscal year ending March 2025.<BR><BR>Breakdown:<BR>Fortis Health's net sales have steadily increased from 4,469.36 Cr in March 2019 to 7,782.75 Cr in March 2025, reflecting a robust growth trend. The total operating income followed a similar pattern, rising from 4,469.36 Cr to 7,782.75 Cr during the same period. The operating profit (PBDIT) also demonstrated significant improvement, increasing from 317.62 Cr in March 2019 to 1,654.88 Cr in March 2025, with an operating profit margin that improved from 5.04% to 20.4%. Profit before tax reached 995.52 Cr in March 2025, up from a loss of 474.51 Cr in March 2019, while profit after tax rose to 797.86 Cr from a loss of 588.12 Cr in March 2019. The consolidated net profit has shown a positive trend, increasing from -298.93 Cr in March 2019 to 774.21 Cr in March 2025. The company's total assets have grown from 10,954.94 Cr in March 2020 to 13,376.98 Cr in March 2025, and total liabilities increased from 10,954.94 Cr to 13,376.98 Cr during the same period. Cash flow from operating activities improved significantly, reaching 1,423.00 Cr in March 2025 compared to 171.00 Cr in March 2020. Overall, Fortis Health has demonstrated a strong recovery and growth in financial performance over the years.

View full answer

Is Fortis Health. technically bullish or bearish?

06-Nov-2025

As of November 4, 2025, Fortis Health's technical trend is mildly bullish, supported by positive MACD and moving averages, though caution is advised due to mixed signals from the weekly KST and Dow Theory.

As of 4 November 2025, the technical trend for Fortis Health has changed from bullish to mildly bullish. The weekly MACD remains bullish, while the monthly MACD is also bullish, indicating positive momentum. The daily moving averages are bullish, supporting the mildly bullish stance. However, the weekly KST is mildly bearish, and the Dow Theory shows a mildly bearish signal on the weekly timeframe, suggesting some caution. The Bollinger Bands indicate a mildly bullish outlook on both weekly and monthly timeframes. Overall, the current technical stance is mildly bullish, driven primarily by the bullish MACD and moving averages, despite some mixed signals from KST and Dow Theory.

View full answer

Who are the top shareholders of the Fortis Health.?

17-Jul-2025

The top shareholders of Fortis Health include promoters holding 31.17%, mutual funds with 25.77%, and foreign institutional investors (FIIs) at 27.4%. HDFC Mutual Fund is the largest public shareholder, owning 6%, while individual investors hold 10.22%.

The top shareholders of Fortis Health include a mix of promoters, mutual funds, and foreign institutional investors (FIIs). The majority shareholders are the promoters, with Northern Tk Venture Pte. Ltd. holding the highest stake at 31.17%. Mutual funds collectively hold 25.77% of the shares through 27 schemes, while FIIs own 27.4% of the company through 389 different investors. The highest public shareholder is HDFC Mutual Fund, specifically through the HDFC S&P BSE 500 ETF, which holds 6%. Additionally, individual investors account for 10.22% of the shareholding.

View full answer

Has Fortis Health. declared dividend?

06-Jun-2025

Fortis Healthcare Ltd has declared a 10% dividend, amounting to ₹1 per share, with an ex-date of July 24, 2024. The dividend yield is 0.13%, and the company has shown significant price appreciation and total returns across various periods.

Fortis Healthcare Ltd has declared a 10% dividend.<BR><BR>Dividend Details:<BR>- Percentage announced: 10%<BR>- Amount per share: 1 per share<BR>- Ex-date: 24 Jul 24<BR><BR>Dividend Yield: 0.13%.<BR><BR>Total Returns by Period:<BR>In the last 6 months, the price return was 6.7%, the dividend return was 0%, resulting in a total return of 6.7%.<BR><BR>Over the past year, the price return was 71.16%, the dividend return was 0.21%, leading to a total return of 71.37%.<BR><BR>In the 2-year period, the price return was 170.94%, with a dividend return of 0.65%, culminating in a total return of 171.59%.<BR><BR>For the 3-year period, the price return was 214.91%, the dividend return was 0.87%, resulting in a total return of 215.78%.<BR><BR>In the 4-year period, the price return was 236.71%, with a dividend return of 0.84%, leading to a total return of 237.55%.<BR><BR>Over the last 5 years, the price return was 548.54%, the dividend return was 1.56%, resulting in a total return of 550.1%.<BR><BR>Overall, Fortis Healthcare Ltd has declared a dividend while also demonstrating significant price appreciation over the years, with total returns reflecting strong performance across all periods. The dividend yield remains modest, indicating that the company is focusing on growth alongside returning value to shareholders.

View full answer
iScoreScore
Click here to find our call on this stock
Strong Sell
Sell
Hold
Buy
Strong Buy

Dashboard

1

Strong ability to service debt as the company has a low Debt to EBITDA ratio of 1.67 times

 
2

Healthy long term growth as Operating profit has grown by an annual rate 27.61%

 
3

Flat results in Jun 26

4

With ROCE of 12.8, it has a Expensive valuation with a 5.6 Enterprise value to Capital Employed

stock-summaryMojo Parameters

Mojo Parameters

Loading Valuation Snapshot...

Stock DNA

stock-summary
Industry

Hospital

stock-summary
Market cap

INR 68,286 Cr (Mid Cap)

stock-summary
P/E

65.00

stock-summary
Industry P/E

68

stock-summary
Dividend Yield

0.11%

stock-summary
Debt Equity

0.29

stock-summary
Return on Equity

10.70%

stock-summary
Price to Book

6.96

Revenue and Profits:
Net Sales:
2,545 Cr
(Quarterly Results - Jun 2026)
Net Profit:
266 Cr
stock-summaryTotal Returns
Total Returns (Price + Dividend) stock-summary
Dividend Yield (0.11%)
TimePeriod
Price Return
Dividend Return
Total Return
3 Months
-8.55%
0.10%
-8.45%
6 Months
2.65%
0.12%
2.77%
1 Year
-6.49%
0.10%
-6.39%
2 Years
61.36%
0.33%
61.69%
3 Years
166.7%
0.89%
167.59%
4 Years
214.06%
1.54%
215.6%
5 Years
226.42%
1.44%
227.86%

Latest dividend: 1.0032374482539008 per share ex-dividend date: Jul-24-2026

Risk Adjusted Returns v/s stock-summary
Returns Beta
Icon
Beta has not been calculated since enough price history is not available
stock-summaryNews & Corporate Actions

Announcements stock-summary

Announcement under Regulation 30 (LODR)-Analyst / Investor Meet - Outcome

04-Sep-2026 | Source : BSE

The Relevant disclosure is attached.

Announcement Under Regulation 30 (LODR) - Regarding Order Passed By The HonBle Delhi High Court In Relation To Certain Applications Filed By Daiichi Sankyo Company Limited Inter Alia The Company. Detailed Disclosure Is Attached.

01-Sep-2026 | Source : BSE

Relevant disclosure is attached.

Announcement under Regulation 30 (LODR)-Analyst / Investor Meet - Intimation

01-Sep-2026 | Source : BSE

The Relevant Disclosure is Attached.

Corporate Actions stock-summary

stock-summary
BOARD MEETING

No Upcoming Board Meetings

stock-summary
DIVIDEND

Fortis Healthcare Ltd has declared 10% dividend, ex-date: 24 Jul 26

stock-summary
SPLITS

No Splits history available

stock-summary
BONUS

No Bonus history available

stock-summary
RIGHTS

Fortis Healthcare Ltd has announced 2:5 rights issue, ex-date: 18 Aug 09

stock-summaryKey Factors

Quality key factors stock-summary

Factor
Value
Sales Growth (5y)
14.48%
EBIT Growth (5y)
27.61%
EBIT to Interest (avg)
6.01
Debt to EBITDA (avg)
1.24
Net Debt to Equity (avg)
0.29
Sales to Capital Employed (avg)
0.74
Tax Ratio
22.36%
Dividend Payout Ratio
9.75%
Pledged Shares
0
Institutional Holding
57.43%
ROCE (avg)
10.93%
ROE (avg)
7.94%

Valuation key factors

Factor
Value
P/E Ratio
65
Industry P/E
68
Price to Book Value
6.96
EV to EBIT
43.19
EV to EBITDA
33.67
EV to Capital Employed
5.60
EV to Sales
7.55
PEG Ratio
4.17
Dividend Yield
0.11%
ROCE (Latest)
12.77%
ROE (Latest)
10.70%

Technicals key factors

Indicator
Weekly
Monthly
MACD
Mildly Bearish
Mildly Bearish
RSI
No Signal
No Signal
Bollinger Bands
Mildly Bearish
Bullish
Moving Averages
Mildly Bullish (Daily)
KST
Mildly Bearish
Mildly Bearish
Dow Theory
Mildly Bearish
No Trend
OBV
Mildly Bullish
No Trend
stock-summary Technical Indicator Scale: Bearish, Mildly Bearish, Sideways, Mildly Bullish, Bullish  Turned 
stock-summaryShareholding
Shareholding Snapshot : Jun 2026stock-summary
Shareholding Compare (%holding) stock-summary
Majority shareholders

Promoters

Pledged Promoter Holdings

None

Mutual Funds

Held by 41 Schemes (25.81%)

FIIs

Held by 628 FIIs (25.2%)

Promoter with highest holding

Northern Tk Venture Pte. Ltd. (31.17%)

Highest Public shareholder

Hdfc Mutual Fund - Hdfc Pharma And Healthcare Fund (6.54%)

Individual Investors Holdings

9.87%

stock-summaryFinancial
[
  {
    "link": "quarterly",
    "btn_text": "All Quarterly Results",
    "header": "Quarterly Results Snapshot (Consolidated) - Jun'26 - QoQ",
    "rhs": [
      {
        "prefix": "Net Sales ",
        "suffix": "QoQ Growth in quarter ended Jun 2026 is 7.63% vs 4.40% in Mar 2026",
        "dir": 1
      },
      {
        "prefix": "Consolidated Net Profit ",
        "suffix": "QoQ Growth in quarter ended Jun 2026 is 0.20% vs 37.23% in Mar 2026",
        "dir": -1
      }
    ],
    "table": {
      "header": [
        "Jun'26",
        "Mar'26",
        "Change(%)"
      ],
      "body": [
        {
          "field": "Net Sales",
          "val1": "2,545.03",
          "val2": "2,364.67",
          "chgp": "7.63%",
          "chgp_class": "positive"
        },
        {
          "field": "Operating Profit (PBDIT) excl Other Income",
          "val1": "537.12",
          "val2": "532.33",
          "chgp": "0.90%",
          "chgp_class": "positive"
        },
        {
          "field": "Interest",
          "val1": "80.44",
          "val2": "84.28",
          "chgp": "-4.56%",
          "chgp_class": "positive"
        },
        {
          "field": "Exceptional Items",
          "val1": "9.53",
          "val2": "-12.49",
          "chgp": "176.30%",
          "chgp_class": "positive"
        },
        {
          "field": "Consolidate Net Profit",
          "val1": "266.39",
          "val2": "265.85",
          "chgp": "0.20%",
          "chgp_class": "positive"
        },
        {
          "field": "Operating Profit Margin (Excl OI)",
          "val1": "21.10%",
          "val2": "22.51%",
          "chgp": "-1.41%",
          "chgp_class": "negative"
        }
      ]
    }
  },
  {
    "link": "half-yearly",
    "btn_text": "All Half Yearly Results",
    "header": "Half Yearly Results Snapshot (Consolidated) - Sep'25",
    "rhs": [
      {
        "prefix": "Net Sales ",
        "suffix": " Growth in half year ended Sep 2025 is 16.92% vs 12.25% in Sep 2024",
        "dir": 1
      },
      {
        "prefix": "Consolidated Net Profit ",
        "suffix": " Growth in half year ended Sep 2025 is 70.03% vs 19.95% in Sep 2024",
        "dir": 1
      }
    ],
    "table": {
      "header": [
        "Sep'25",
        "Sep'24",
        "Change(%)"
      ],
      "body": [
        {
          "field": "Net Sales",
          "val1": "4,498.16",
          "val2": "3,847.29",
          "chgp": "16.92%",
          "chgp_class": "positive"
        },
        {
          "field": "Operating Profit (PBDIT) excl Other Income",
          "val1": "1,047.00",
          "val2": "777.35",
          "chgp": "34.69%",
          "chgp_class": "positive"
        },
        {
          "field": "Interest",
          "val1": "144.45",
          "val2": "71.70",
          "chgp": "101.46%",
          "chgp_class": "negative"
        },
        {
          "field": "Exceptional Items",
          "val1": "36.16",
          "val2": "-59.57",
          "chgp": "160.70%",
          "chgp_class": "positive"
        },
        {
          "field": "Consolidate Net Profit",
          "val1": "582.20",
          "val2": "342.42",
          "chgp": "70.03%",
          "chgp_class": "positive"
        },
        {
          "field": "Operating Profit Margin (Excl OI)",
          "val1": "23.28%",
          "val2": "20.21%",
          "chgp": "3.07%",
          "chgp_class": "positive"
        }
      ]
    }
  },
  {
    "link": "nine-monthly",
    "btn_text": "All Nine Monthly Results",
    "header": "Nine Monthly Results Snapshot (Consolidated) - Dec'25",
    "rhs": [
      {
        "prefix": "Net Sales ",
        "suffix": "YoY Growth in nine months ended Dec 2025 is 17.10% vs 13.09% in Dec 2024",
        "dir": 1
      },
      {
        "prefix": "Consolidated Net Profit ",
        "suffix": "YoY Growth in nine months ended Dec 2025 is 31.44% vs 40.50% in Dec 2024",
        "dir": -1
      }
    ],
    "table": {
      "header": [
        "Dec'25",
        "Dec'24",
        "Change(%)"
      ],
      "body": [
        {
          "field": "Net Sales",
          "val1": "6,763.17",
          "val2": "5,775.55",
          "chgp": "17.10%",
          "chgp_class": "positive"
        },
        {
          "field": "Operating Profit (PBDIT) excl Other Income",
          "val1": "1,552.65",
          "val2": "1,152.47",
          "chgp": "34.72%",
          "chgp_class": "positive"
        },
        {
          "field": "Interest",
          "val1": "230.19",
          "val2": "116.85",
          "chgp": "97.00%",
          "chgp_class": "negative"
        },
        {
          "field": "Exceptional Items",
          "val1": "-9.75",
          "val2": "-35.77",
          "chgp": "72.74%",
          "chgp_class": "positive"
        },
        {
          "field": "Consolidate Net Profit",
          "val1": "775.93",
          "val2": "590.32",
          "chgp": "31.44%",
          "chgp_class": "positive"
        },
        {
          "field": "Operating Profit Margin (Excl OI)",
          "val1": "22.96%",
          "val2": "19.95%",
          "chgp": "3.01%",
          "chgp_class": "positive"
        }
      ]
    }
  },
  {
    "link": "annual",
    "btn_text": "All Annual Results",
    "header": "Annual Results Snapshot (Consolidated) - Mar'26",
    "rhs": [
      {
        "prefix": "Net Sales ",
        "suffix": "YoY Growth in year ended Mar 2026 is 17.28% vs 12.91% in Mar 2025",
        "dir": 1
      },
      {
        "prefix": "Consolidated Net Profit ",
        "suffix": "YoY Growth in year ended Mar 2026 is 34.56% vs 29.28% in Mar 2025",
        "dir": 1
      }
    ],
    "table": {
      "header": [
        "Mar'26",
        "Mar'25",
        "Change(%)"
      ],
      "body": [
        {
          "field": "Net Sales",
          "val1": "9,127.84",
          "val2": "7,782.75",
          "chgp": "17.28%",
          "chgp_class": "positive"
        },
        {
          "field": "Operating Profit (PBDIT) excl Other Income",
          "val1": "2,084.98",
          "val2": "1,587.94",
          "chgp": "31.30%",
          "chgp_class": "positive"
        },
        {
          "field": "Interest",
          "val1": "314.47",
          "val2": "184.41",
          "chgp": "70.53%",
          "chgp_class": "negative"
        },
        {
          "field": "Exceptional Items",
          "val1": "-22.24",
          "val2": "-89.34",
          "chgp": "75.11%",
          "chgp_class": "positive"
        },
        {
          "field": "Consolidate Net Profit",
          "val1": "1,041.78",
          "val2": "774.21",
          "chgp": "34.56%",
          "chgp_class": "positive"
        },
        {
          "field": "Operating Profit Margin (Excl OI)",
          "val1": "22.84%",
          "val2": "20.40%",
          "chgp": "2.44%",
          "chgp_class": "positive"
        }
      ]
    }
  }
]

Quarterly Results Snapshot (Consolidated) - Jun'26 - QoQstock-summary

Jun'26
Mar'26
Change(%)
Net Sales
2,545.03
2,364.67
7.63%
Operating Profit (PBDIT) excl Other Income
537.12
532.33
0.90%
Interest
80.44
84.28
-4.56%
Exceptional Items
9.53
-12.49
176.30%
Consolidate Net Profit
266.39
265.85
0.20%
Operating Profit Margin (Excl OI)
21.10%
22.51%
-1.41%
Values in Rs Cr.
Direction Arrows
Net Sales

QoQ Growth in quarter ended Jun 2026 is 7.63% vs 4.40% in Mar 2026

Direction Arrows
Consolidated Net Profit

QoQ Growth in quarter ended Jun 2026 is 0.20% vs 37.23% in Mar 2026

Half Yearly Results Snapshot (Consolidated) - Sep'25stock-summary

Sep'25
Sep'24
Change(%)
Net Sales
4,498.16
3,847.29
16.92%
Operating Profit (PBDIT) excl Other Income
1,047.00
777.35
34.69%
Interest
144.45
71.70
101.46%
Exceptional Items
36.16
-59.57
160.70%
Consolidate Net Profit
582.20
342.42
70.03%
Operating Profit Margin (Excl OI)
23.28%
20.21%
3.07%
Values in Rs Cr.
Direction Arrows
Net Sales

Growth in half year ended Sep 2025 is 16.92% vs 12.25% in Sep 2024

Direction Arrows
Consolidated Net Profit

Growth in half year ended Sep 2025 is 70.03% vs 19.95% in Sep 2024

Nine Monthly Results Snapshot (Consolidated) - Dec'25stock-summary

Dec'25
Dec'24
Change(%)
Net Sales
6,763.17
5,775.55
17.10%
Operating Profit (PBDIT) excl Other Income
1,552.65
1,152.47
34.72%
Interest
230.19
116.85
97.00%
Exceptional Items
-9.75
-35.77
72.74%
Consolidate Net Profit
775.93
590.32
31.44%
Operating Profit Margin (Excl OI)
22.96%
19.95%
3.01%
Values in Rs Cr.
Direction Arrows
Net Sales

YoY Growth in nine months ended Dec 2025 is 17.10% vs 13.09% in Dec 2024

Direction Arrows
Consolidated Net Profit

YoY Growth in nine months ended Dec 2025 is 31.44% vs 40.50% in Dec 2024

Annual Results Snapshot (Consolidated) - Mar'26stock-summary

Mar'26
Mar'25
Change(%)
Net Sales
9,127.84
7,782.75
17.28%
Operating Profit (PBDIT) excl Other Income
2,084.98
1,587.94
31.30%
Interest
314.47
184.41
70.53%
Exceptional Items
-22.24
-89.34
75.11%
Consolidate Net Profit
1,041.78
774.21
34.56%
Operating Profit Margin (Excl OI)
22.84%
20.40%
2.44%
Values in Rs Cr.
Direction Arrows
Net Sales

YoY Growth in year ended Mar 2026 is 17.28% vs 12.91% in Mar 2025

Direction Arrows
Consolidated Net Profit

YoY Growth in year ended Mar 2026 is 34.56% vs 29.28% in Mar 2025

stock-summaryCompany CV
About Fortis Healthcare Ltd stock-summary
stock-summary
Fortis Healthcare Ltd
Mid Cap
Hospital
Fortis Healthcare Limited (FHL) is one of the largest healthcare services providers in India with 36 hospitals, ~6,100 operational beds and 400+ diagnostics centres as of 31 March, 2026. The Company offers a full spectrum of integrated healthcare services ranging from clinics to quaternary care facilities and a wide range of ancillary services to patients in areas such as Cardiac Care, Orthopedics, Neurosciences, Oncology, renal care, Gastroenterology and Mother and Child care. .
Company Coordinates stock-summary
Company Details
Fortis Hospital Sector-62, Phase-VIII Mohali Punjab : 160062
stock-summary
Tel: 91-172-5096001
stock-summary
secretarial@fortishealthcare.com
Registrar Details
Karvy Computershare Pvt Ltd, Plot No 17-24 , Near Image Hospital,, Reliance Cybervilae,Vithalrao Nagar,, Madhapur, Hyderabad