
Compare Foundry Fuel with Similar Stocks
Dashboard
With a Negative Book Value, the company has a Weak Long Term Fundamental Strength
- Poor long term growth as Net Sales has grown by an annual rate of % and Operating profit at 0% over the last 5 years
- High Debt Company with a Debt to Equity ratio (avg) at 0 times
Flat results in Dec 25
Risky - Negative EBITDA
Total Returns (Price + Dividend) 
Foundry Fuel for the last several years.
Risk Adjusted Returns v/s
Returns Beta

News
Are Foundry Fuel Products Ltd latest results good or bad?
The latest financial results for Foundry Fuel Products Ltd indicate a challenging operational landscape. For the quarter ending December 2025, the company reported net sales of ₹0.00 crore, marking a continuation of zero revenue generation for over seven consecutive quarters. This persistent lack of sales reflects a complete operational shutdown of its metallurgical coke manufacturing facility, which has not produced any output despite having an installed capacity of 45,000 metric tonnes per annum. The company's net loss for the quarter was ₹0.04 crore, which remained unchanged from the previous quarter. While this loss is marginally better than the ₹0.05 crore loss reported in the prior quarter, it highlights the ongoing financial distress. The operating profit also showed a similar trend, with a loss of ₹0.04 crore, indicating no significant operational recovery. Additionally, the balance sheet reveals ...
Read full news article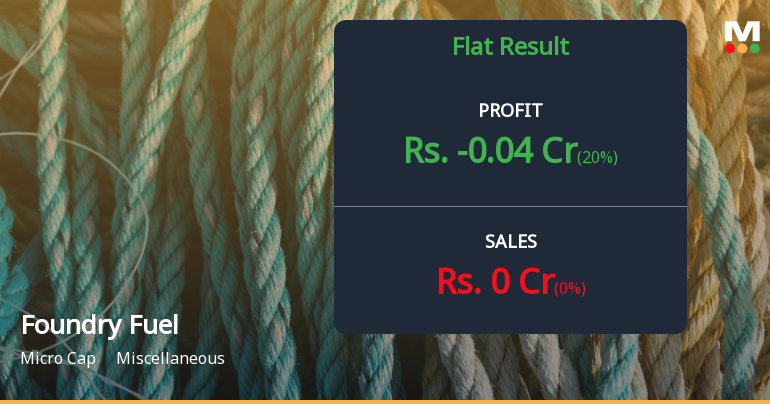
Foundry Fuel Products Q3 FY26: Dormant Operations Continue as Losses Mount
Foundry Fuel Products Ltd., a micro-cap metallurgical coke manufacturer, continues to report zero revenue operations in Q3 FY26, posting a net loss of ₹0.04 crores for the quarter ended December 2025. The company, which operates a 45,000 MTPA Low Ash Metallurgical Coke plant in Jharkhand, has not generated any sales for at least the past seven quarters, raising serious concerns about operational viability and going concern status.
Read full news article Announcements
Format of the Annual Disclosure to be made by an entity identified as a LC - Annexure B2
06-Apr-2026 | Source : BSEFormat of the Annual Disclosure to be made by an entity identified as a Large Corporate.
| Sr. No. | Particulars | Details |
| 1 | Name of Company | Foundry Fuel Products Ltd |
| 2 | CIN NO. | L50500WB1964PLC026053 |
| 3 | Report filed for FY | 2025-2026 |
| Details of the Current block (all figures in Rs crore): | ||
| 4 | 2 - year block period (Specify financial years)* | N.A |
| 5 | Incremental borrowing done in FY (T)(a) | 0.00 |
| 6 | Mandatory borrowing to be done through debt securities in FY (T) (b) = (25% of a) | 0.00 |
| 7 | Actual borrowing done through debt securities in FY (T)(c) | 0.00 |
| 8 | Shortfall in the borrowing through debt securities if any for FY (T - 1) carried forward to FY (T) (d) | Nil |
| 8 | Quantum of (d) which has been met from (c)(e)* | Nil |
| 9 | Shortfall if any in the mandatory borrowing through debt securities for FY (T) { after adjusting for any shortfall in borrowing for FY(T - 1) which was carried forward to FY(T)}(f) = (b) - [(c) - (e)]{ If the calculated value is zero or negative write nil}* | Nil |
| Details of penalty to be paid if any in respect to previous block (all figures in Rs crore): | |
| 2 - year Block period (Specify financial years) | N.A |
| Amount of fine to be paid for the block if applicable Fine = 0.2% of {(d) - (e)}# | 0.00 |
| Name of the Company Secretary :- | Om Prakash Ojha |
| Designation :- | Company Secretary |
| Name of the Chief Financial Officer :- | Avinash Landge |
| Designation : - | CFO |
Date: 06/04/2026
Disclosures under Reg. 29(2) of SEBI (SAST) Regulations 2011
01-Apr-2026 | Source : BSEThe Exchange has received the disclosure under Regulation 29(2) of SEBI (Substantial Acquisition of Shares & Takeovers) Regulations 2011 for Madhu Agarwalla
Disclosures under Reg. 29(2) of SEBI (SAST) Regulations 2011
01-Apr-2026 | Source : BSEThe Exchange has received the disclosure under Regulation 29(2) of SEBI (Substantial Acquisition of Shares & Takeovers) Regulations 2011 for Shrutika Agarwalla
Corporate Actions

No Upcoming Board Meetings

No Dividend history available

Foundry Fuel Products Ltd has announced 10:5 stock split, ex-date: 14 Jun 12

No Bonus history available

No Rights history available
Quality key factors
Valuation key factors
Technicals key factors
 Technical Indicator Scale: Bearish, Mildly Bearish, Sideways, Mildly Bullish, Bullish Turned
 Shareholding Snapshot : Dec 2025
Shareholding Compare (%holding)
Promoters
None
Held by 0 Schemes
Held by 0 FIIs
Castron Mining Limited (50.55%)
Bal Binode Bajoria (2.87%)
24.11%
Quarterly Results Snapshot (Standalone) - Dec'25 - YoY
YoY Growth in quarter ended Dec 2025 is 0.00% vs 0.00% in Dec 2024

YoY Growth in quarter ended Dec 2025 is 20.00% vs 0.00% in Dec 2024
Half Yearly Results Snapshot (Standalone) - Sep'25
Not Applicable: The company has declared_date for only one period
Not Applicable: The company has declared_date for only one period
Nine Monthly Results Snapshot (Standalone) - Dec'25
YoY Growth in nine months ended Dec 2025 is 0.00% vs 0.00% in Dec 2023

YoY Growth in nine months ended Dec 2025 is 7.14% vs 12.50% in Dec 2023
Annual Results Snapshot (Standalone) - Mar'25
YoY Growth in year ended Mar 2025 is 0.00% vs 0.00% in Mar 2024
YoY Growth in year ended Mar 2025 is 0.00% vs -13.64% in Mar 2024
About Foundry Fuel Products Ltd

Company Coordinates


