
Compare Franklin Indust. with Similar Stocks
Stock DNA
Trading & Distributors
INR 31 Cr (Micro Cap)
NA (Loss Making)
35
0.00%
0.00
-14.51%
0.27
Total Returns (Price + Dividend) 
Franklin Indust. for the last several years.
Risk Adjusted Returns v/s
Returns Beta

News

Franklin Industries Ltd is Rated Strong Sell
Franklin Industries Ltd is rated Strong Sell by MarketsMOJO, with this rating last updated on 05 Aug 2025. However, the analysis and financial metrics discussed here reflect the stock’s current position as of 28 May 2026, providing investors with an up-to-date view of the company’s performance and outlook.
Read full news articleAre Franklin Industries Ltd latest results good or bad?
Franklin Industries Ltd has reported significant operational challenges in its latest financial results for Q4 FY26. The company experienced a dramatic decline in net sales, which fell by 93.03% year-on-year to ₹6.37 crores, compared to ₹91.37 crores in the same quarter of the previous year. This decline reflects a severe drop in revenue generation, raising concerns about the sustainability of its business model. The net profit for the quarter was a loss of ₹11.06 crores, marking a substantial deterioration from a profit of ₹3.99 crores in Q4 FY25. This represents a staggering year-on-year decline of 218.73%. The operating margin also turned sharply negative at -172.84%, indicating that the company is incurring operating expenses that are nearly three times its revenue, which is unsustainable for ongoing operations. Despite a sequential revenue growth of 1,125% from the previous quarter, this figure is mi...
Read full news article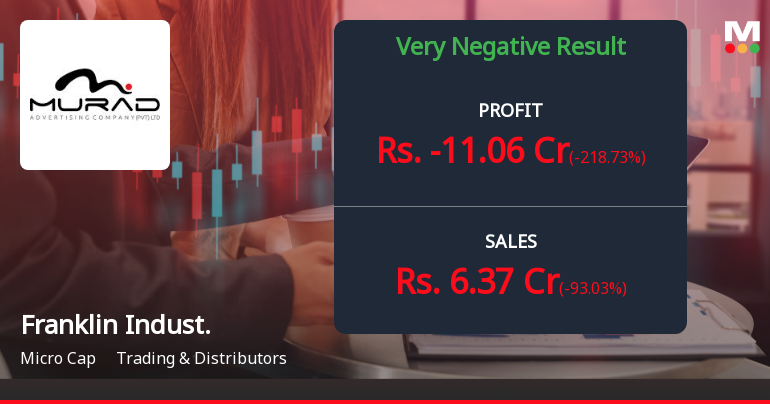
Franklin Industries Q4 FY26: Losses Mount as Revenue Collapses 93% YoY
Franklin Industries Limited, a micro-cap trading and distribution company, reported deeply troubling Q4 FY26 results, with net profit collapsing to a loss of ₹11.06 crores from a profit of ₹3.99 crores in the year-ago quarter. The Ahmedabad-based firm, which operates in contract farming services, witnessed revenues plunge 93.03% year-on-year to just ₹6.37 crores, signalling severe operational distress that has sent the stock tumbling 70.90% over the past year to trade at ₹0.41.
Read full news article Announcements
Non-Applicability Of Large Corporate Clause
08-Jun-2026 | Source : BSENon-Applicability of Large Corporate Clause
Announcement under Regulation 30 (LODR)-Resignation of Company Secretary / Compliance Officer
02-Jun-2026 | Source : BSEIntimation of Resignation of Company Secretary and Compliance officer of the Company
Compliances-Reg.24(A)-Annual Secretarial Compliance
28-May-2026 | Source : BSEPursuant to Regulation 24A of SEBI (Listing Obligations and Disclosures Requirements) Regulations 2015 we are enclosing herein with the Annual Secretarial Compliance Report for the Financial Year ended on 31st March 2026.
Corporate Actions

No Upcoming Board Meetings

No Dividend history available

Franklin Industries Ltd has announced 1:10 stock split, ex-date: 11 Jan 24

Franklin Industries Ltd has announced 1:1 bonus issue, ex-date: 09 Sep 24

Franklin Industries Ltd has announced 5:3 rights issue, ex-date: 04 Jun 25
Quality key factors
Valuation key factors
Technicals key factors
 Technical Indicator Scale: Bearish, Mildly Bearish, Sideways, Mildly Bullish, Bullish Turned
 Shareholding Snapshot : Mar 2026
Shareholding Compare (%holding)
Non Institution
None
Held by 0 Schemes
Held by 0 FIIs
None
Naveen Kumar (1.3%)
95.9%
Quarterly Results Snapshot (Standalone) - Mar'26 - YoY

YoY Growth in quarter ended Mar 2026 is -93.03% vs 405.92% in Mar 2025
YoY Growth in quarter ended Mar 2026 is -218.73% vs -161.31% in Mar 2025
Half Yearly Results Snapshot (Standalone) - Sep'25
Growth in half year ended Sep 2025 is -65.82% vs 240.13% in Sep 2024
Growth in half year ended Sep 2025 is -77.62% vs 614.81% in Sep 2024
Nine Monthly Results Snapshot (Standalone) - Dec'25
YoY Growth in nine months ended Dec 2025 is -77.48% vs 157.85% in Dec 2024
YoY Growth in nine months ended Dec 2025 is -143.28% vs 169.58% in Dec 2024
Annual Results Snapshot (Standalone) - Mar'26
YoY Growth in year ended Mar 2026 is -85.59% vs 246.46% in Mar 2025
YoY Growth in year ended Mar 2026 is -266.85% vs 6.69% in Mar 2025
About Franklin Industries Ltd

Company Coordinates


