
Compare Frontline Corp. with Similar Stocks
Dashboard
High Debt company with Weak Long Term Fundamental Strength
- Poor long term growth as Operating profit has grown by an annual rate 18.73% of over the last 5 years
- High Debt Company with a Debt to Equity ratio (avg) of 4.11 times
- The company has been able to generate a Return on Capital Employed (avg) of 0.16% signifying low profitability per unit of total capital (equity and debt)
Flat results in Mar 26
Underperformed the market in the last 1 year
Stock DNA
Transport Services
INR 17 Cr (Micro Cap)
7.00
13
0.00%
3.00
13.49%
0.93
Total Returns (Price + Dividend) 
Frontline Corp. for the last several years.
Risk Adjusted Returns v/s
Returns Beta

News
Are Frontline Corporation Ltd latest results good or bad?
Frontline Corporation Ltd's latest financial results for the quarter ended March 2026 reveal a complex picture of growth accompanied by significant operational challenges. The company reported net sales of ₹33.05 crores, reflecting an 18.20% increase compared to the previous quarter, which is a notable achievement in terms of revenue generation. However, the net profit for the same quarter was ₹0.83 crores, which, while showing an 80.43% quarter-on-quarter increase, also highlights a concerning trend as it represents a decline of 5.68% year-on-year. Despite the revenue growth, the operating margin remains low at 2.18%, indicating that the company is struggling to convert sales into meaningful profit. This margin has fluctuated over the past quarters, demonstrating volatility without a clear upward trend. The company's reliance on non-operating income is particularly alarming, as it constituted a significan...
Read full news article
Frontline Corporation Ltd Upgraded to Sell on Improved Valuation Metrics
Frontline Corporation Ltd, a micro-cap player in the transport services sector, has seen its investment rating upgraded from Strong Sell to Sell as of 1 June 2026. This change is primarily driven by a marked improvement in valuation metrics, even as the company continues to grapple with weak financial trends and operational challenges. The latest assessment by MarketsMOJO reflects a nuanced view balancing attractive price levels against ongoing fundamental concerns.
Read full news article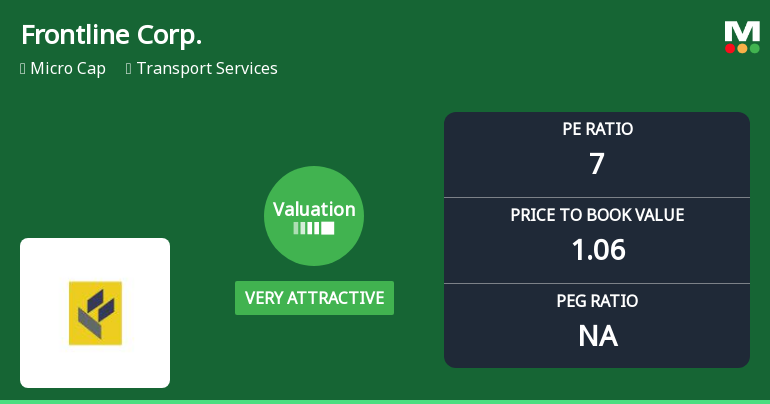
Frontline Corporation Ltd Valuation Shifts Signal Renewed Price Attractiveness
Frontline Corporation Ltd, a micro-cap player in the Transport Services sector, has witnessed a significant shift in its valuation parameters, moving from a risky to a very attractive valuation grade. This change, coupled with its current price metrics and peer comparisons, offers investors a fresh perspective on the stock’s price attractiveness amid a challenging market backdrop.
Read full news article Announcements
Announcement under Regulation 30 (LODR)-Newspaper Publication
01-Jun-2026 | Source : BSESubmission of Newpaper Publication of the Audited Annual Financial Results for the 4th quarter and financial year ended on 31.03.2026
Audited Financiaal Results For The Financial Year Ended On 31.03.2026
30-May-2026 | Source : BSEaudited financial results for the year ended on 31.03.2026
Board Meeting Outcome for Outcome Of Board Meeting For Adoption Of Audited Financial Results For The 4Th Quarter And Financial Year Ended On 31.03.2026
30-May-2026 | Source : BSEOutcome of Board Meeting for adoption of audited financial results for the 4th quarter and financial year ended on 31.03.2026
Corporate Actions

No Upcoming Board Meetings

No Dividend history available

No Splits history available

No Bonus history available

No Rights history available
Quality key factors
Valuation key factors
Technicals key factors
 Technical Indicator Scale: Bearish, Mildly Bearish, Sideways, Mildly Bullish, Bullish Turned
 Shareholding Snapshot : Mar 2026
Shareholding Compare (%holding)
Non Institution
None
Held by 0 Schemes
Held by 0 FIIs
Ram Prasad Agarwala (7.77%)
Mudhra Fine Blanc Private Limited (11.21%)
28.17%
Quarterly Results Snapshot (Standalone) - Mar'26 - QoQ

QoQ Growth in quarter ended Mar 2026 is 18.20% vs 8.12% in Dec 2025
QoQ Growth in quarter ended Mar 2026 is 80.43% vs -16.36% in Dec 2025
Half Yearly Results Snapshot (Standalone) - Sep'25
Growth in half year ended Sep 2025 is 14.43% vs 13.60% in Sep 2024

Growth in half year ended Sep 2025 is -13.85% vs 132.14% in Sep 2024
Nine Monthly Results Snapshot (Standalone) - Dec'25
YoY Growth in nine months ended Dec 2025 is 13.06% vs 15.56% in Dec 2024
YoY Growth in nine months ended Dec 2025 is -21.39% vs 107.22% in Dec 2024
Annual Results Snapshot (Standalone) - Mar'26
YoY Growth in year ended Mar 2026 is 13.84% vs 18.34% in Mar 2025
YoY Growth in year ended Mar 2026 is -16.61% vs 136.89% in Mar 2025
About Frontline Corporation Ltd

Company Coordinates


