
Compare Frontline Plc with Similar Stocks
Dashboard
Poor Management Efficiency with a low ROCE of 8.98%
- The company has been able to generate a Return on Capital Employed (avg) of 8.98% signifying low profitability per unit of total capital (equity and debt)
The company has declared Negative results for the last 3 consecutive quarters
With ROCE of 9.96%, it has a very attractive valuation with a 1.29 Enterprise value to Capital Employed
Total Returns (Price + Dividend) 
Frontline Plc for the last several years.
Risk Adjusted Returns v/s
News

Frontline Plc Hits New 52-Week High at USD 26.00, Showcasing Strong Momentum
Frontline Plc, a small-cap transport services company, recently achieved a new 52-week high, rebounding from its previous low. With a market capitalization of USD 5,103 million, a P/E ratio of 11.00, and a dividend yield of 10.03%, the company showcases a balanced financial profile amid market fluctuations.
Read full news article
Frontline Plc Hits New 52-Week High at USD 25.95
Frontline Plc achieved a new 52-week high of USD 25.95 on November 20, 2025, following a low of USD 12.40. The company, with a market cap of USD 5,103 million, has a P/E ratio of 11.00, a dividend yield of 10.03%, and a debt-to-equity ratio of 1.31.
Read full news article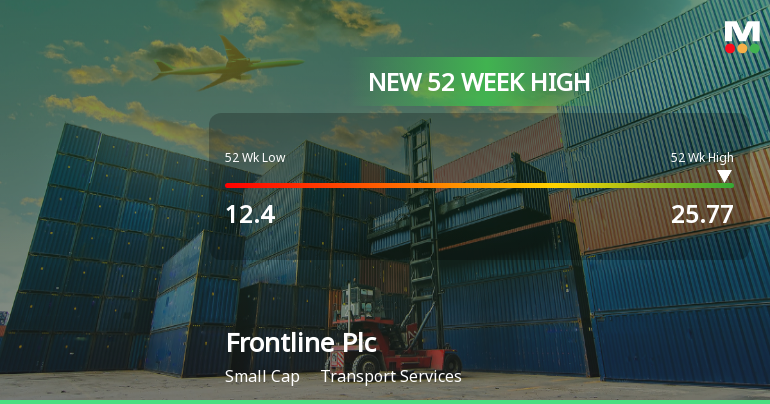
Frontline Plc Hits New 52-Week High at USD 25.77
Frontline Plc has achieved a new 52-week high, reflecting its position in the transport services industry. The company has a market capitalization of USD 5,103 million, a P/E ratio of 11.00, and a dividend yield of 10.03%. Its financial metrics indicate a solid standing within the sector.
Read full news article Announcements

Corporate Actions
Quality key factors
Valuation key factors
Technicals key factors
 Technical Indicator Scale: Bearish, Mildly Bearish, Sideways, Mildly Bullish, Bullish Turned
 Shareholding Snapshot : Sep 2025
Shareholding Compare (%holding)
Foreign Institutions
Held in 33 Schemes (6.13%)
Held by 126 Foreign Institutions (15.38%)
Quarterly Results Snapshot (Consolidated) - Sep'25 - QoQ

QoQ Growth in quarter ended Sep 2025 is -9.87% vs 12.20% in Jun 2025
QoQ Growth in quarter ended Sep 2025 is -48.00% vs 132.73% in Jun 2025
Annual Results Snapshot (Consolidated) - Dec'24
YoY Growth in year ended Dec 2024 is 14.16% vs 26.04% in Dec 2023
YoY Growth in year ended Dec 2024 is -24.50% vs 38.04% in Dec 2023
About Frontline Plc

Company Coordinates


