
Compare FRUTA FRUTA, Inc. with Similar Stocks
Dashboard
1
The company has declared Positive results for the last 4 consecutive quarters
- NET SALES(Q) At JPY 1,068.92 MM has Grown at 126.3%
- PRE-TAX PROFIT(Q) At JPY 154.29 MM has Grown at 4,435.24%
- NET PROFIT(Q) At JPY 132.81 MM has Grown at 4,097.38%
2
With ROE of 9.17%, it has a attractive valuation with a 3.82 Price to Book Value
Total Returns (Price + Dividend) 
TimePeriod
Price Return
Dividend Return
Total Return
3 Months
1.52%
0%
1.52%
6 Months
1.52%
0%
1.52%
1 Year
262.16%
0%
262.16%
2 Years
83.56%
0%
83.56%
3 Years
38.14%
0%
38.14%
4 Years
-39.37%
0%
-39.37%
5 Years
-11.84%
0%
-11.84%
FRUTA FRUTA, Inc. for the last several years.
Risk Adjusted Returns v/s
News
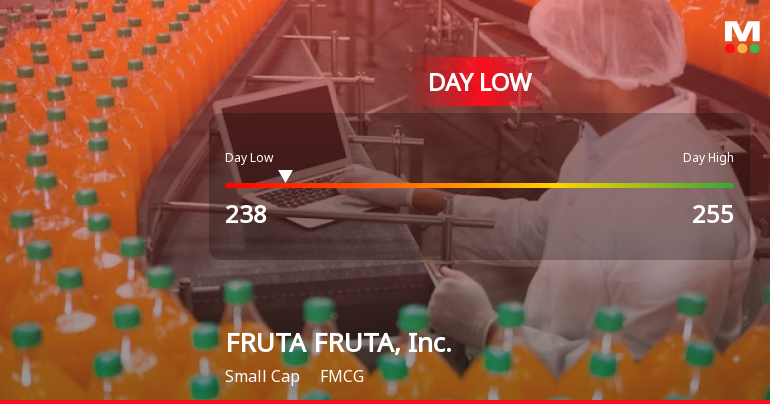
FRUTA FRUTA, Inc. Hits Day Low at JPY 238 Amid Price Pressure
FRUTA FRUTA, Inc. faced a notable stock decline today, reaching an intraday low. Despite this, the company has demonstrated strong financial performance over the past year, with substantial net profit growth and consistent positive results. Year-to-date, the stock has significantly outperformed the Japan Nikkei 225 index.
Read full news article Announcements

No announcement available
Corporate Actions
No corporate action available
Quality key factors
Factor
Value
Sales Growth (5y)
22.13%
EBIT Growth (5y)
20.73%
EBIT to Interest (avg)
-63.98
Debt to EBITDA (avg)
Negative Net Debt
Net Debt to Equity (avg)
-0.64
Sales to Capital Employed (avg)
0.89
Tax Ratio
Tax Ratio is Negative%
Dividend Payout Ratio
0
Pledged Shares
0
Institutional Holding
0
ROCE (avg)
4.30%
ROE (avg)
1.83%
Valuation key factors
Factor
Value
P/E Ratio
42
Industry P/E
Price to Book Value
3.82
EV to EBIT
41.01
EV to EBITDA
41.01
EV to Capital Employed
8.81
EV to Sales
3.69
PEG Ratio
0.29
Dividend Yield
NA
ROCE (Latest)
21.48%
ROE (Latest)
9.17%
Technicals key factors
Indicator
Weekly
Monthly
MACD
Mildly Bullish
Mildly Bearish
RSI
No Signal
No Signal
Bollinger Bands
Bearish
Bearish
Moving Averages
Bearish (Daily)
KST
Bearish
Mildly Bearish
Dow Theory
Mildly Bearish
No Trend
OBV
Mildly Bearish
No Trend
 Technical Indicator Scale: Bearish, Mildly Bearish, Sideways, Mildly Bullish, Bullish Turned
 Shareholding Snapshot
No data for shareholding present.
Shareholding Compare (%holding)
No data for shareholding present.
Quarterly Results Snapshot (Consolidated) - Jun'25 - YoY
Jun'25
Jun'24
Change(%)
Net Sales
1,068.90
472.30
126.32%
Operating Profit (PBDIT) excl Other Income
162.70
14.60
1,014.38%
Interest
2.50
0.90
177.78%
Exceptional Items
0.00
0.00
Consolidate Net Profit
132.80
3.20
4,050.00%
Operating Profit Margin (Excl OI)
151.20%
30.90%
12.03%
USD in Million.

Net Sales
YoY Growth in quarter ended Jun 2025 is 126.32% vs 74.47% in Jun 2024
Consolidated Net Profit
YoY Growth in quarter ended Jun 2025 is 4,050.00% vs 103.20% in Jun 2024
Annual Results Snapshot (Consolidated) - Mar'25
Mar'25
Mar'24
Change(%)
Net Sales
2,549.50
1,136.90
124.25%
Operating Profit (PBDIT) excl Other Income
230.80
-263.10
187.72%
Interest
19.00
28.90
-34.26%
Exceptional Items
0.00
1.50
-100.00%
Consolidate Net Profit
271.00
-306.40
188.45%
Operating Profit Margin (Excl OI)
90.10%
-231.40%
32.15%
USD in Million.
Net Sales
YoY Growth in year ended Mar 2025 is 124.25% vs 41.25% in Mar 2024
Consolidated Net Profit
YoY Growth in year ended Mar 2025 is 188.45% vs 0.62% in Mar 2024
About FRUTA FRUTA, Inc.

FRUTA FRUTA, Inc.
FMCG
No Details Available.
Company Coordinates
No Company Details Available
InfinHub Market Technologies FZ-LLC, Building-2, Unit 112, Dubai Internet City, Dubai, United Arab Emirates
GET THE MARKETSMOJO APP


Company
Stocks
Portfolio


"Investment in securities markets are subject to market risk. Read all the related documents carefully before investing."