
Compare Future Market with Similar Stocks
Dashboard
High Debt company with Weak Long Term Fundamental Strength
- Poor long term growth as Net Sales has grown by an annual rate of 4.73% and Operating profit at 19.96% over the last 5 years
- High Debt Company with a Debt to Equity ratio (avg) of 3.18 times
- The company has been able to generate a Return on Equity (avg) of 2.54% signifying low profitability per unit of shareholders funds
The company has declared Negative results for the last 4 consecutive quarters
84.32% of Promoter Shares are Pledged
Underperformed the market in the last 1 year
Stock DNA
Diversified Commercial Services
INR 59 Cr (Micro Cap)
NA (Loss Making)
33
0.00%
1.50
0.16%
0.56
Total Returns (Price + Dividend) 
Future Market for the last several years.
Risk Adjusted Returns v/s
Returns Beta

News

Future Market Networks Ltd is Rated Strong Sell
Future Market Networks Ltd is rated Strong Sell by MarketsMOJO. This rating was last updated on 14 Jul 2025, reflecting a reassessment of the stock’s outlook. However, the analysis and financial metrics presented here are based on the company’s current position as of 06 May 2026, providing investors with the latest insights into its performance and prospects.
Read full news article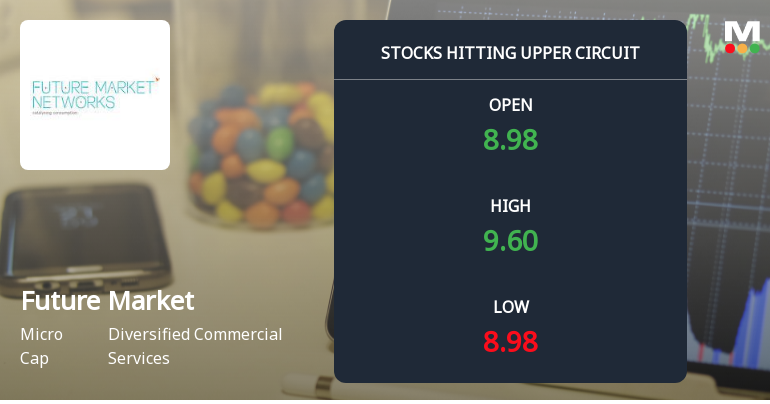
Future Market Networks Ltd Locks at Upper Circuit With 8.73% Gain — Buyers Queue, Sellers Absent
At Rs 9.58, the buying was done — not because demand dried up, but because the exchange wouldn't let the stock go any higher. Future Market Networks Ltd locked at its upper circuit of 8.73% on 27 Apr 2026, with buyers queuing and no sellers willing to part with shares.
Read full news article
Future Market Networks Ltd is Rated Strong Sell
Future Market Networks Ltd is rated Strong Sell by MarketsMOJO. This rating was last updated on 14 July 2025. However, the analysis and financial metrics presented here reflect the stock's current position as of 24 April 2026, providing investors with the latest insights into the company’s performance and outlook.
Read full news article Announcements
Future Market Networks Limited - Other General Purpose
09-Dec-2019 | Source : NSEFuture Market Networks Limited has informed the Exchange regarding Disclosure of Related Party Transaction under Regulation 23(9) of the SEBI (Listing Obligations and Disclosure Requirements) Regulations, 2015.
Future Market Networks Limited - Updates
18-Nov-2019 | Source : NSEFuture Market Networks Limited has informed the Exchange regarding 'Dear Sir/Madam,
Future Market Networks Limited - Updates
14-Nov-2019 | Source : NSEFuture Market Networks Limited has informed the Exchange regarding 'Sub: Postal Ballot Ref: Scrip Code: BSE 533296 and NSE FMNL With reference to the above, please note that the Committee of Directors at their meeting held on November 14, 2019, interalia, transacted the following: To seek the approval of shareholders of the Company by way of postal ballot pursuant to section 110 of the Companies Act, 2013 read with the Companies (Management and Administration) Rules, 2014, for approval of Related Party Transactions with Riddhi Siddhi Mall Management Private Limited. '.
Corporate Actions

No Upcoming Board Meetings

No Dividend history available

No Splits history available

No Bonus history available

No Rights history available
Quality key factors
Valuation key factors
Technicals key factors
 Technical Indicator Scale: Bearish, Mildly Bearish, Sideways, Mildly Bullish, Bullish Turned
 Shareholding Snapshot : Mar 2026
Shareholding Compare (%holding)
Promoters
84.3211
Held by 1 Schemes (0.0%)
Held by 0 FIIs
Future Corporate Resources Private Limited (58.67%)
Mable Rajesh (1.02%)
26.27%
Quarterly Results Snapshot (Consolidated) - Dec'25 - QoQ

QoQ Growth in quarter ended Dec 2025 is -0.08% vs -0.41% in Sep 2025

QoQ Growth in quarter ended Dec 2025 is -27.51% vs 73.55% in Sep 2025
Half Yearly Results Snapshot (Consolidated) - Sep'25
Growth in half year ended Sep 2025 is -3.84% vs 9.03% in Sep 2024
Growth in half year ended Sep 2025 is -95.25% vs 1,580.23% in Sep 2024
Nine Monthly Results Snapshot (Consolidated) - Dec'25
YoY Growth in nine months ended Dec 2025 is -4.82% vs 9.79% in Dec 2024
YoY Growth in nine months ended Dec 2025 is -93.53% vs 7,507.75% in Dec 2024
Annual Results Snapshot (Consolidated) - Mar'25
YoY Growth in year ended Mar 2025 is 8.57% vs 0.68% in Mar 2024
YoY Growth in year ended Mar 2025 is 1,166.88% vs 31.30% in Mar 2024
About Future Market Networks Ltd

Company Coordinates


