
Compare Future Market with Similar Stocks
Dashboard
High Debt company with Weak Long Term Fundamental Strength
- Poor long term growth as Net Sales has grown by an annual rate of 7.39% over the last 5 years
- High Debt Company with a Debt to Equity ratio (avg) of 3.70 times
- The company has been able to generate a Return on Capital Employed (avg) of 6.84% signifying low profitability per unit of total capital (equity and debt)
84.32% of Promoter Shares are Pledged
Underperformed the market in the last 1 year
Stock DNA
Diversified Commercial Services
INR 61 Cr (Micro Cap)
8.00
32
0.00%
1.26
7.15%
0.55
Total Returns (Price + Dividend) 
Future Market for the last several years.
Risk Adjusted Returns v/s
Returns Beta

News

Future Market Networks Ltd Locks at Upper Circuit With 5% Gain — Buyers Queue, Sellers Absent
At Rs 11.26, the buying was done — not because demand dried up, but because the exchange wouldn't let the stock go any higher. Future Market Networks Ltd locked at its upper circuit of 5% on 1 Jun 2026, with buyers queuing and no sellers willing to part with shares.
Read full news article
Future Market Networks Ltd is Rated Sell
Future Market Networks Ltd is rated 'Sell' by MarketsMOJO, with this rating last updated on 19 May 2026. However, the analysis and financial metrics discussed here reflect the stock's current position as of 29 May 2026, providing investors with an up-to-date view of the company’s fundamentals, valuation, financial trends, and technical outlook.
Read full news article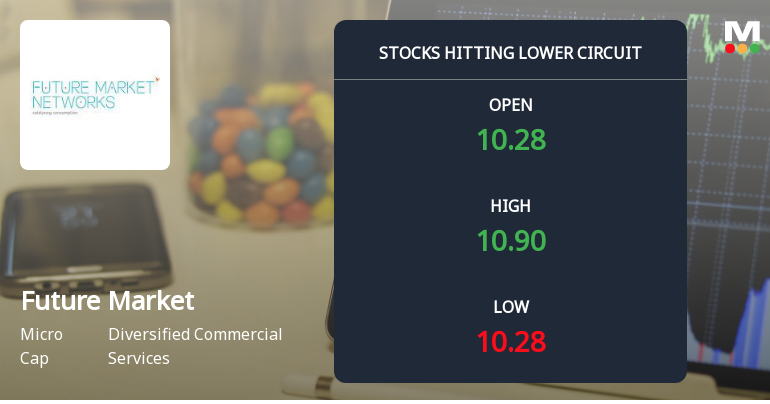
Future Market Networks Ltd Locks at Lower Circuit With 4.9% Loss — Sellers Queue, No Buyers in Sight
At Rs 10.22, sellers were still queuing — but there were no buyers willing to take the other side. Future Market Networks Ltd locked at its lower circuit of 4.93% on 25 May 2026, with unfilled sell orders and a frozen price, reflecting persistent selling pressure in a micro-cap stock with limited liquidity.
Read full news article Announcements
Corrigendum To The Notice Of Extra Ordinary General Meeting
08-Jun-2026 | Source : BSECorrigendum to the notice of extra ordinary general meeting
Corrigendum To The Notice Of Extra Ordinary General Meeting
08-Jun-2026 | Source : BSECorrigendum to the notice of extra ordinary general meeting
Disclosure Of Utilization Of The Proceeds Of Preferential Issue In Terms Of Regulation 32 Of The Of The SEBI (LODR) Regulations 2015.
29-May-2026 | Source : BSEAs attached
Corporate Actions

No Upcoming Board Meetings

No Dividend history available

No Splits history available

No Bonus history available

No Rights history available
Quality key factors
Valuation key factors
Technicals key factors
 Technical Indicator Scale: Bearish, Mildly Bearish, Sideways, Mildly Bullish, Bullish Turned
 Shareholding Snapshot : Mar 2026
Shareholding Compare (%holding)
Promoters
84.3211
Held by 1 Schemes (0.0%)
Held by 0 FIIs
Future Corporate Resources Private Limited (58.67%)
Mable Rajesh (1.02%)
26.27%
Quarterly Results Snapshot (Consolidated) - Mar'26 - QoQ

QoQ Growth in quarter ended Mar 2026 is 4.56% vs -0.08% in Dec 2025
QoQ Growth in quarter ended Mar 2026 is -10.77% vs -27.51% in Dec 2025
Half Yearly Results Snapshot (Consolidated) - Sep'25

Growth in half year ended Sep 2025 is -3.84% vs 9.03% in Sep 2024
Growth in half year ended Sep 2025 is -95.25% vs 1,580.23% in Sep 2024
Nine Monthly Results Snapshot (Consolidated) - Dec'25
YoY Growth in nine months ended Dec 2025 is -4.82% vs 9.79% in Dec 2024
YoY Growth in nine months ended Dec 2025 is -93.53% vs 7,507.75% in Dec 2024
Annual Results Snapshot (Consolidated) - Mar'26
YoY Growth in year ended Mar 2026 is -2.44% vs 8.57% in Mar 2025
YoY Growth in year ended Mar 2026 is -88.01% vs 1,166.88% in Mar 2025
About Future Market Networks Ltd

Company Coordinates


