Futuristic Solu

  • Market Cap: Micro Cap
  • Industry: Non Banking Financial Company (NBFC)
  • ISIN: INE241F01011
  • NSEID:
  • BSEID: 534063
INR
40.47
0.00 (0.00%)
BSENSE

Sep 01, 03:30 PM

BSE+NSE Vol: 15

  • Price Points
  • Score
  • Mojo Parameters
  • Total Return
  • News and Corporate Actions
  • Key factors
  • Shareholding
  • Financials
  • CompanyCV
stock-summaryPrice Point
High/Low

1Day

52 Week

Valuation
Technical
Day's Volume

CASH

15 (-55.09%) Volume

Shareholding (Jun 2026)

FII

0.00%

Held by 0 FIIs

DII

0.00%

Held by 0 DIIs

Promoter

68.49%

Why is Futuristic Solutions Ltd falling/rising?

02-Sep-2026

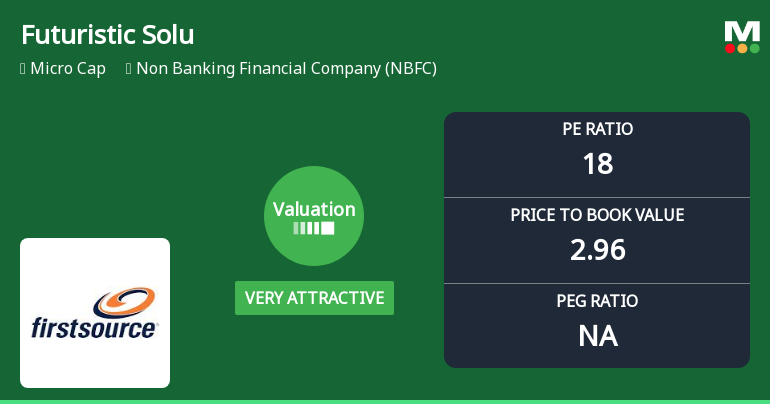
As of 01-Sep, the stock price of Futuristic Solutions Ltd is stable at 40.47 but has declined 10.66% year-to-date and 12.69% over the past year, indicating a bearish trend and reduced investor interest. Despite attractive short-term valuations, long-term fundamentals appear weak, contributing to negative sentiment around the stock.

As of 01-Sep, the stock price of Futuristic Solutions Ltd is currently stable at 40.47, showing no change (0.00%). However, the stock has experienced a decline over various periods, with a year-to-date decrease of 10.66% and a one-year drop of 12.69%. This downward trend is further highlighted by its performance compared to the benchmark Sensex, which has only fallen by 4.26% over the same period.<BR><BR>Despite some positive financial results reported on June 26, including the highest quarterly profits before and after tax, the stock is trading lower than its moving averages across multiple time frames, indicating a bearish trend. Additionally, there has been a significant decrease in investor participation, with delivery volume dropping by 98.09% against the five-day average, suggesting a lack of interest from investors.<BR><BR>While the company has a relatively attractive valuation with a return on equity (ROE) of 16.7 and a price-to-book value of 2.6, the long-term fundamental strength appears weak, as indicated by an average ROE of only 6.42%. This combination of declining stock performance, reduced investor engagement, and weak long-term fundamentals contributes to the overall negative sentiment surrounding Futuristic Solutions Ltd, leading to its current price stagnation and previous declines.

View full answer

Who are in the management team of Futuristic Solu?

01-Sep-2026

The management team of Futuristic Solu includes Mandeep Sandhu (Chairman & Managing Director), Sangeeta Sandhu (Director), and five Independent Directors: Sunil Gupta, Sanjiv Kumar Taneja, Anupam Dev, and Deepika Singh, along with Khushboo Gautam as Company Secretary & Compliance Officer.

The management team of Futuristic Solu includes the following members:<BR><BR>1. **Mandeep Sandhu** - Chairman & Managing Director<BR>2. **Sangeeta Sandhu** - Director<BR>3. **Sunil Gupta** - Independent Director<BR>4. **Sanjiv Kumar Taneja** - Independent Director<BR>5. **Anupam Dev** - Independent Director<BR>6. **Khushboo Gautam** - Company Secretary & Compliance Officer<BR>7. **Deepika Singh** - Independent Director<BR><BR>If you need more specific information about any of these individuals or their roles, feel free to ask!

View full answer

What does Futuristic Solu do?

01-Sep-2026

Futuristic Solutions Ltd is a Non Banking Financial Company (NBFC) operating in the micro-cap market, with recent quarterly net sales of 3 Cr and net profit of 2 Cr as of June 2026. The company, originally founded in 1983, focuses on financial services and has a market cap of INR 42 Cr.

Overview:<BR>Futuristic Solutions Ltd operates as a Non Banking Financial Company (NBFC) within the micro-cap market segment.<BR><BR>History:<BR>The company was originally incorporated in 1983 as Moral Leasing Private Limited and later transitioned to a Public Limited Company. It underwent a name change to Futuristic Solutions Limited in 2002. The latest quarterly results reported net sales and net profit for June 2026.<BR><BR>Financial Snapshot:<BR>- Net Sales: 3 Cr (Quarterly Results - Jun 2026)<BR>- Net Profit: 2 Cr (Quarterly Results - Jun 2026)<BR>- Market-cap: INR 42 Cr (Micro Cap)<BR><BR>Key Metrics:<BR>- P/E: 16.00<BR>- Industry P/E: 21<BR>- Dividend Yield: 0.00%<BR>- Debt Equity: 0.00<BR>- Return on Equity: 16.70%<BR>- Price to Book: 2.64<BR><BR>Contact Details:<BR>Address: M-50 Second Floor M-Block, Market Greater Kailash Part-1 New Delhi New Delhi : 110048<BR>Tel: 91-11-41630436/41634701<BR>Email: futuristicsolutions@gmail.com<BR>Website: http://www.fsl.co.in

View full answer

Who are the peers of the Futuristic Solu?

01-Sep-2026

Futuristic Solu's peers include Key Corp, Morgan Ventures, Caspian Corporat, and others, with varying management risks and growth rates. Its 1-year return is -12.38%, better than Caspian Corporat's -47.83% but worse than Relic Tech's -1.94%.

Peers: The peers of Futuristic Solu are Key Corp, Morgan Ventures, Caspian Corporat, ARC Finance, Nam Securities, Sugal & Damani, Relic Tech., AD Manum Finance, Lak. Fin. & Indl, and MASK INVESTMENTS.<BR><BR>Quality Snapshot: Excellent management risk is observed at Key Corp, Morgan Ventures, ARC Finance, Sugal & Damani, and the rest. Average management risk is found at Caspian Corporat and the rest. Below Average management risk is noted at Futuristic Solu, Nam Securities, Relic Tech., AD Manum Finance, Lak. Fin. & Indl, and MASK INVESTMENTS. Growth is Excellent at Morgan Ventures, Futuristic Solu, Sugal & Damani, and the rest, while Good growth is seen at ARC Finance and AD Manum Finance. Below Average growth is present at Key Corp, Caspian Corporat, Nam Securities, Relic Tech., and Lak. Fin. & Indl. Finally, Excellent capital structure is noted at Key Corp, Morgan Ventures, ARC Finance, Nam Securities, Futuristic Solu, Sugal & Damani, Relic Tech., AD Manum Finance, Lak. Fin. & Indl, and MASK INVESTMENTS, while Below Average capital structure is found at Caspian Corporat.<BR><BR>Return Snapshot: The peer with the highest 1-year return is Relic Tech. at -1.94%, while the lowest is Caspian Corporat at -47.83%. Futuristic Solu's 1-year return of -12.38% is better than Caspian Corporat but worse than Relic Tech. Additionally, peers with negative six-month returns include Morgan Ventures, Caspian Corporat, ARC Finance, and Nam Securities.

View full answer

How big is Futuristic Solu?

01-Sep-2026

As of 31st August, Futuristic Solutions Ltd has a market capitalization of 42.00 Cr, with Net Sales of 9.15 Cr and a Net Profit of 2.68 Cr reported in the latest four quarters. The company has Shareholder's Funds of 16.05 Cr and Total Assets of 19.62 Cr as of March 2026.

As of 31st August, Futuristic Solutions Ltd has a market capitalization of 42.00 Cr, categorizing it as a Micro Cap company.<BR><BR>In the latest four quarters, Futuristic Solutions Ltd reported Net Sales of 9.15 Cr and a Net Profit of 2.68 Cr.<BR><BR>For the reporting period of March 2026, the company had Shareholder's Funds amounting to 16.05 Cr and Total Assets of 19.62 Cr.

View full answer

Should I buy, sell or hold Futuristic Solutions Ltd?

17-Aug-2026

Are Futuristic Solutions Ltd latest results good or bad?

30-Apr-2026

Futuristic Solutions Ltd's latest results are largely negative, showing a significant revenue increase of 438% but a 52.73% drop in net profit and a drastic decline in profit margins. The low Return on Equity and high P/E ratio further indicate concerns about the company's financial sustainability, leading to a "Strong Sell" rating.

The latest results for Futuristic Solutions Ltd present a mixed picture, leaning towards negative overall. In Q4 FY26, the company reported net sales of ₹5.38 crores, which is a remarkable quarter-on-quarter increase of 438%. However, this surge came at a significant cost to profitability, as net profit fell by 52.73% to ₹0.26 crores from ₹0.55 crores in the previous quarter. <BR><BR>The profit after tax (PAT) margin also saw a drastic decline, dropping from 55.0% to just 4.83%. This sharp contraction indicates that while the company is generating more revenue, it is struggling to maintain profitability, which raises concerns about the sustainability of its business model.<BR><BR>Additionally, the Return on Equity (ROE) is quite low at 3.15%, well below the average for the industry, signaling weak capital efficiency. The company's valuation metrics are concerning as well, with a P/E ratio of 78.88, significantly higher than the industry average of around 22. This suggests that the stock may be overvalued relative to its performance.<BR><BR>Overall, while there are some positive signs in terms of revenue growth, the decline in profit margins, low ROE, and high valuation multiples indicate that the latest results are not favorable for Futuristic Solutions Ltd. The investment outlook appears to be quite negative, with a "Strong Sell" rating reflecting the market's lack of confidence in the company's ability to improve its financial performance.

View full answer

When is the next results date for Futuristic Solutions Ltd?

22-Apr-2026

The next results date for Futuristic Solutions Ltd is April 29, 2026.

The next results date for Futuristic Solutions Ltd is scheduled for April 29, 2026.

View full answer

Is Futuristic Solu overvalued or undervalued?

05-Dec-2025

As of December 4, 2025, Futuristic Solu is considered a very expensive investment due to its unsustainable financial metrics, including a PE ratio of -641.50 and a year-to-date return of -32.76%, significantly underperforming compared to its peers and the Sensex.

As of 4 December 2025, the valuation grade for Futuristic Solu has moved from risky to very expensive, indicating a significant deterioration in its attractiveness as an investment. The company is currently overvalued, with a staggering PE ratio of -641.50, an EV to EBIT of -45.07, and an EV to Sales ratio of 45.07. These figures suggest that the company's financial performance is not only poor but also unsustainable at its current valuation.<BR><BR>In comparison to its peers, Futuristic Solu stands out negatively; for instance, Bajaj Finance has a PE ratio of 34.9 and an EV to EBITDA of 19.63, while Life Insurance boasts a much more favorable PE ratio of 10.85 and an EV to EBITDA of 8.92. The stark contrast in these ratios highlights the overvaluation of Futuristic Solu within its industry. Additionally, the company's year-to-date return of -32.76% significantly underperforms the Sensex's 9.12%, reinforcing the notion that it is not a viable investment at this time.

View full answer

How has been the historical performance of Futuristic Solu?

13-Nov-2025

Futuristic Solu's historical performance has been marked by significant declines in net sales and profitability, with net sales dropping from 3.56 Cr in March 2023 to 0.20 Cr in March 2025, resulting in negative operating profit and profit after tax. Total assets and liabilities decreased to 15.86 Cr, while cash reserves remained stable at 6.00 Cr.

Answer:<BR>The historical performance of Futuristic Solu has shown significant fluctuations over the years, particularly in net sales and profitability. In March 2025, net sales dropped to 0.20 Cr from 3.04 Cr in March 2024, and 3.56 Cr in March 2023, indicating a downward trend after a peak in March 2023. The total operating income followed a similar pattern, decreasing from 3.04 Cr in March 2024 to 0.20 Cr in March 2025. Operating profit (PBDIT) also saw a decline, moving from 1.99 Cr in March 2024 to a loss of 0.05 Cr in March 2025. Profit after tax mirrored this trend, falling from 1.41 Cr in March 2024 to a loss of 0.06 Cr in March 2025. The company's operating profit margin turned negative at -310.0% in March 2025, compared to 49.34% in March 2024, reflecting the severe impact of reduced sales on profitability.<BR><BR>On the balance sheet, total assets decreased from 16.95 Cr in March 2024 to 15.86 Cr in March 2025, while total liabilities also fell from 16.95 Cr to 15.86 Cr in the same period. The company's cash and cash equivalents remained stable at 6.00 Cr in March 2024 and March 2025. The book value per share slightly decreased from 14.63 in March 2024 to 14.58 in March 2025. Overall, Futuristic Solu's financial performance has been characterized by a significant decline in sales and profitability in the most recent fiscal year, following a period of relative stability and growth.<BR><BR>Breakdown:<BR>Futuristic Solu's financial performance has exhibited notable volatility, particularly in net sales, which plummeted from 3.56 Cr in March 2023 to just 0.20 Cr in March 2025. This decline in revenue has adversely affected total operating income, which also fell sharply to 0.20 Cr in March 2025 from 3.04 Cr in the previous year. The operating profit (PBDIT) transitioned from a profit of 1.99 Cr in March 2024 to a loss of 0.05 Cr in March 2025, indicating a significant deterioration in operational efficiency. Profit after tax followed suit, decreasing from 1.41 Cr to a loss of 0.06 Cr, with the operating profit margin reflecting this downturn at -310.0% in March 2025. On the balance sheet, total assets and liabilities both decreased to 15.86 Cr, while cash and cash equivalents remained stable at 6.00 Cr. The book value per share slightly declined, indicating a challenging financial landscape for the company in the latest fiscal year.

View full answer

Who are the top shareholders of the Futuristic Solu?

17-Jul-2025

The top shareholders of Futuristic Solu are Mishry Holdings Limited with 24.99%, Nandita Shaunik with 30.36%, and individual investors holding 31.42%. There are no pledged promoter holdings, and the company has no mutual funds or foreign institutional investors.

The top shareholders of Futuristic Solu include Mishry Holdings Limited, which holds 24.99% of the shares, making it the largest promoter. The highest public shareholder is Nandita Shaunik, who owns 30.36% of the company. Additionally, individual investors collectively hold 31.42% of the shares. Notably, there are no pledged promoter holdings, and the company does not have any mutual funds or foreign institutional investors holding shares.

View full answer

What is the technical trend for Futuristic Solu?

09-Jun-2025

As of June 3, 2025, Futuristic Solu's trend is mildly bearish due to daily moving averages and monthly MACD signals, despite some short-term strength indicated by weekly indicators, suggesting a cautious approach is advisable.

As of 3 June 2025, the technical trend for Futuristic Solu has changed from bearish to mildly bearish. The current stance is mildly bearish, driven primarily by the daily moving averages indicating bearish momentum and the monthly MACD showing a mildly bearish signal. The weekly MACD and KST are mildly bullish, suggesting some short-term strength, but this is overshadowed by the bearish signals from the Bollinger Bands and the daily moving averages. The lack of clear signals from the RSI further supports a neutral outlook in the absence of strong momentum. Overall, the mixed signals indicate a cautious approach is warranted.

View full answer

Has Futuristic Solu declared dividend?

06-Jun-2025

Futuristic Solutions Ltd has declared a 10% dividend, amounting to 1 per share, with an ex-date of July 5, 2024. Despite the dividend, total returns have varied significantly, showing negative returns in the short term and positive returns over longer periods.

Futuristic Solutions Ltd has declared a 10% dividend.<BR><BR>Dividend Details:<BR>- Percentage announced: 10%<BR>- Amount per share: 1 per share<BR>- Ex-date: 05 Jul 24<BR><BR>Dividend Yield: 1.85%.<BR><BR>Total Returns by Period:<BR>In the last 6 months, the price return was -18.55%, the dividend return was 0%, resulting in a total return of -18.55%.<BR><BR>Over the past year, the price return was -47.17%, with a dividend return of 0.96%, leading to a total return of -46.21%.<BR><BR>For the 2-year period, the price return was -18.91%, the dividend return was 2.92%, culminating in a total return of -15.99%.<BR><BR>In the 3-year period, the price return was 77.78%, the dividend return was 6.12%, resulting in a total return of 83.9%.<BR><BR>Over the last 4 years, the price return was 143.48%, the dividend return was 8.33%, leading to a total return of 151.81%.<BR><BR>In the 5-year period, the price return was 68.42%, the dividend return was 6.25%, resulting in a total return of 74.67%.<BR><BR>Overall, while Futuristic Solutions Ltd has declared a dividend, the total returns over various periods show significant fluctuations, with negative returns in the shorter terms and positive returns in the longer terms. The dividend yield indicates some return to shareholders, despite the challenges reflected in the price returns.

View full answer
iScoreScore
Click here to find our call on this stock
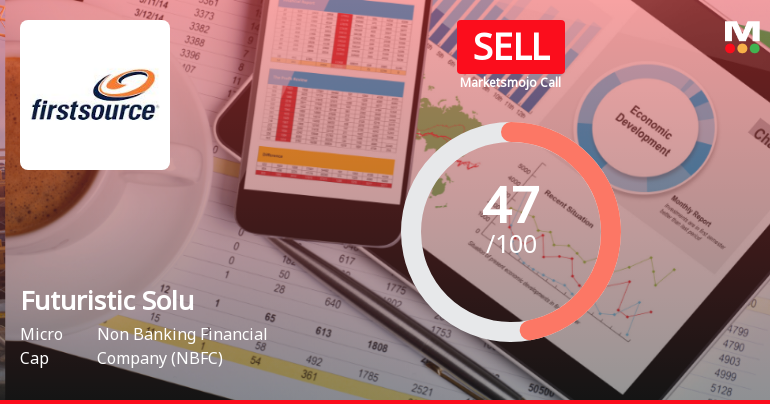
Strong Sell
Sell
Hold
Buy
Strong Buy

Dashboard

1

Weak Long Term Fundamental Strength with an average Return on Equity (ROE) of 6.42%

 
stock-summaryMojo Parameters

Mojo Parameters

Loading Valuation Snapshot...

Stock DNA

stock-summary
Industry

Non Banking Financial Company (NBFC)

stock-summary
Market cap

INR 42 Cr (Micro Cap)

stock-summary
P/E

16.00

stock-summary
Industry P/E

85

stock-summary
Dividend Yield

0.00%

stock-summary
Debt Equity

0.00

stock-summary
Return on Equity

16.70%

stock-summary
Price to Book

2.64

Revenue and Profits:
Net Sales:
3 Cr
(Quarterly Results - Jun 2026)
Net Profit:
2 Cr
stock-summaryTotal Returns
Total Returns (Price + Dividend) stock-summary
Dividend Yield (0%)
TimePeriod
Price Return
Dividend Return
Total Return
3 Months
-15.69%
0%
-15.69%
6 Months
0%
0%
0.0%
1 Year
-12.69%
0%
-12.69%
2 Years
-56.69%
0%
-56.69%
3 Years
-13.43%
1.64%
-11.79%
4 Years
0%
5.35%
5.35%
5 Years
0%
10.10%
10.1%

Latest dividend: 1 per share ex-dividend date: Jul-05-2024

Risk Adjusted Returns v/s stock-summary
Returns Beta
Icon
Beta has not been calculated since enough price history is not available
stock-summaryNews & Corporate Actions

News

Futuristic Solutions Ltd Falls 6.13%: Valuation Shifts and Downgrade Drive Weekly Decline

Announcements stock-summary

Shareholder Meeting / Postal Ballot-Outcome of AGM

21-Aug-2026 | Source : BSE

Outcomes of 43rd Annual General Meeting with Voting Results

Shareholder Meeting / Postal Ballot-Scrutinizers Report

21-Aug-2026 | Source : BSE

Scrutinizers Report

Shareholder Meeting / Postal Ballot-Outcome of AGM

20-Aug-2026 | Source : BSE

Outcomes of 43rd Annual General Meeting.

Corporate Actions stock-summary

stock-summary
BOARD MEETING

No Upcoming Board Meetings

stock-summary
DIVIDEND

Futuristic Solutions Ltd has declared 10% dividend, ex-date: 05 Jul 24

stock-summary
SPLITS

No Splits history available

stock-summary
BONUS

No Bonus history available

stock-summary
RIGHTS

No Rights history available

stock-summaryKey Factors

Quality key factors stock-summary

Factor
Value
Sales Growth (5y)
57.40%
EBIT Growth (5y)
36.04%
Net Debt to Equity (avg)
0
Institutional Holding
0
ROE (avg)
6.42%

Valuation key factors

Factor
Value
P/E Ratio
16
Industry P/E
85
Price to Book Value
2.64
EV to EBIT
10.17
EV to EBITDA
10.17
EV to Capital Employed
5.24
EV to Sales
3.56
PEG Ratio
NA
Dividend Yield
NA
ROCE (Latest)
-8.22%
ROE (Latest)
16.70%

Technicals key factors

Indicator
Weekly
Monthly
MACD
Bearish
Bearish
RSI
No Signal
No Signal
Bollinger Bands
Mildly Bearish
Bearish
Moving Averages
Bearish (Daily)
KST
Mildly Bearish
Mildly Bullish
Dow Theory
No Trend
Mildly Bearish
stock-summary Technical Indicator Scale: Bearish, Mildly Bearish, Sideways, Mildly Bullish, Bullish  Turned 
stock-summaryShareholding
Shareholding Snapshot : Jun 2026stock-summary
Shareholding Compare (%holding) stock-summary
Majority shareholders

Promoters

Pledged Promoter Holdings

None

Mutual Funds

Held by 0 Schemes

FIIs

Held by 0 FIIs

Promoter with highest holding

Mishry Holdings Ltd (24.99%)

Highest Public shareholder

Nandita Shaunik (30.36%)

Individual Investors Holdings

31.41%

stock-summaryFinancial
[
  {
    "link": "quarterly",
    "btn_text": "All Quarterly Results",
    "header": "Quarterly Results Snapshot (Standalone) - Jun'26 - YoY",
    "rhs": [
      {
        "prefix": "Net Sales ",
        "suffix": "YoY Growth in quarter ended Jun 2026 is 0.00% vs 0.00% in Jun 2025",
        "dir": 0
      },
      {
        "prefix": "Standalone Net Profit ",
        "suffix": "YoY Growth in quarter ended Jun 2026 is 18,900.00% vs 85.71% in Jun 2025",
        "dir": 1
      }
    ],
    "table": {
      "header": [
        "Jun'26",
        "Jun'25",
        "Change(%)"
      ],
      "body": [
        {
          "field": "Net Sales",
          "val1": "2.62",
          "val2": "0.00",
          "chgp": "",
          "chgp_class": "neutral"
        },
        {
          "field": "Operating Profit (PBDIT) excl Other Income",
          "val1": "2.45",
          "val2": "-0.12",
          "chgp": "2,141.67%",
          "chgp_class": "positive"
        },
        {
          "field": "Interest",
          "val1": "0.00",
          "val2": "0.01",
          "chgp": "-100.00%",
          "chgp_class": "positive"
        },
        {
          "field": "Exceptional Items",
          "val1": "0.00",
          "val2": "0.00",
          "chgp": "",
          "chgp_class": "neutral"
        },
        {
          "field": "Standalone Net Profit",
          "val1": "1.88",
          "val2": "-0.01",
          "chgp": "18,900.00%",
          "chgp_class": "positive"
        },
        {
          "field": "Operating Profit Margin (Excl OI)",
          "val1": "93.51%",
          "val2": "0.00%",
          "chgp": "93.51%",
          "chgp_class": "positive"
        }
      ]
    }
  },
  {
    "link": "half-yearly",
    "btn_text": "All Half Yearly Results",
    "header": "Half Yearly Results Snapshot (Standalone) - Sep'25",
    "rhs": [
      {
        "prefix": "Net Sales ",
        "suffix": " Growth in half year ended Sep 2025 is -25.00% vs 0.00% in Sep 2024",
        "dir": -1
      },
      {
        "prefix": "Standalone Net Profit ",
        "suffix": " Growth in half year ended Sep 2025 is 0.00% vs -100.00% in Sep 2024",
        "dir": 1
      }
    ],
    "table": {
      "header": [
        "Sep'25",
        "Sep'24",
        "Change(%)"
      ],
      "body": [
        {
          "field": "Net Sales",
          "val1": "0.15",
          "val2": "0.20",
          "chgp": "-25.00%",
          "chgp_class": "negative"
        },
        {
          "field": "Operating Profit (PBDIT) excl Other Income",
          "val1": "-0.26",
          "val2": "-0.33",
          "chgp": "21.21%",
          "chgp_class": "positive"
        },
        {
          "field": "Interest",
          "val1": "0.02",
          "val2": "0.00",
          "chgp": "",
          "chgp_class": "neutral"
        },
        {
          "field": "Exceptional Items",
          "val1": "0.00",
          "val2": "0.00",
          "chgp": "",
          "chgp_class": "neutral"
        },
        {
          "field": "Standalone Net Profit",
          "val1": "-0.02",
          "val2": "0.00",
          "chgp": "",
          "chgp_class": "neutral"
        },
        {
          "field": "Operating Profit Margin (Excl OI)",
          "val1": "-173.33%",
          "val2": "-165.00%",
          "chgp": "-8.33%",
          "chgp_class": "negative"
        }
      ]
    }
  },
  {
    "link": "nine-monthly",
    "btn_text": "All Nine Monthly Results",
    "header": "Nine Monthly Results Snapshot (Standalone) - Dec'25",
    "rhs": [
      {
        "prefix": "Net Sales ",
        "suffix": "YoY Growth in nine months ended Dec 2025 is 475.00% vs -66.10% in Dec 2024",
        "dir": 1
      },
      {
        "prefix": "Standalone Net Profit ",
        "suffix": "YoY Growth in nine months ended Dec 2025 is 5,400.00% vs -107.69% in Dec 2024",
        "dir": 1
      }
    ],
    "table": {
      "header": [
        "Dec'25",
        "Dec'24",
        "Change(%)"
      ],
      "body": [
        {
          "field": "Net Sales",
          "val1": "1.15",
          "val2": "0.20",
          "chgp": "475.00%",
          "chgp_class": "positive"
        },
        {
          "field": "Operating Profit (PBDIT) excl Other Income",
          "val1": "0.34",
          "val2": "-0.46",
          "chgp": "173.91%",
          "chgp_class": "positive"
        },
        {
          "field": "Interest",
          "val1": "0.03",
          "val2": "0.00",
          "chgp": "",
          "chgp_class": "neutral"
        },
        {
          "field": "Exceptional Items",
          "val1": "0.00",
          "val2": "0.00",
          "chgp": "",
          "chgp_class": "neutral"
        },
        {
          "field": "Standalone Net Profit",
          "val1": "0.53",
          "val2": "-0.01",
          "chgp": "5,400.00%",
          "chgp_class": "positive"
        },
        {
          "field": "Operating Profit Margin (Excl OI)",
          "val1": "29.57%",
          "val2": "-230.00%",
          "chgp": "259.57%",
          "chgp_class": "positive"
        }
      ]
    }
  },
  {
    "link": "annual",
    "btn_text": "All Annual Results",
    "header": "Annual Results Snapshot (Standalone) - Mar'26",
    "rhs": [
      {
        "prefix": "Net Sales ",
        "suffix": "YoY Growth in year ended Mar 2026 is 3,160.00% vs -93.42% in Mar 2025",
        "dir": 1
      },
      {
        "prefix": "Standalone Net Profit ",
        "suffix": "YoY Growth in year ended Mar 2026 is 1,400.00% vs -104.26% in Mar 2025",
        "dir": 1
      }
    ],
    "table": {
      "header": [
        "Mar'26",
        "Mar'25",
        "Change(%)"
      ],
      "body": [
        {
          "field": "Net Sales",
          "val1": "6.52",
          "val2": "0.20",
          "chgp": "3,160.00%",
          "chgp_class": "positive"
        },
        {
          "field": "Operating Profit (PBDIT) excl Other Income",
          "val1": "0.58",
          "val2": "-0.62",
          "chgp": "193.55%",
          "chgp_class": "positive"
        },
        {
          "field": "Interest",
          "val1": "0.03",
          "val2": "0.01",
          "chgp": "200.00%",
          "chgp_class": "negative"
        },
        {
          "field": "Exceptional Items",
          "val1": "0.00",
          "val2": "0.00",
          "chgp": "",
          "chgp_class": "neutral"
        },
        {
          "field": "Standalone Net Profit",
          "val1": "0.78",
          "val2": "-0.06",
          "chgp": "1,400.00%",
          "chgp_class": "positive"
        },
        {
          "field": "Operating Profit Margin (Excl OI)",
          "val1": "8.90%",
          "val2": "-310.00%",
          "chgp": "318.90%",
          "chgp_class": "positive"
        }
      ]
    }
  }
]

Quarterly Results Snapshot (Standalone) - Jun'26 - YoYstock-summary

Jun'26
Jun'25
Change(%)
Net Sales
2.62
0.00
Operating Profit (PBDIT) excl Other Income
2.45
-0.12
2,141.67%
Interest
0.00
0.01
-100.00%
Exceptional Items
0.00
0.00
Standalone Net Profit
1.88
-0.01
18,900.00%
Operating Profit Margin (Excl OI)
93.51%
0.00%
93.51%
Values in Rs Cr.
Net Sales

YoY Growth in quarter ended Jun 2026 is 0.00% vs 0.00% in Jun 2025

Direction Arrows
Standalone Net Profit

YoY Growth in quarter ended Jun 2026 is 18,900.00% vs 85.71% in Jun 2025

Half Yearly Results Snapshot (Standalone) - Sep'25stock-summary

Sep'25
Sep'24
Change(%)
Net Sales
0.15
0.20
-25.00%
Operating Profit (PBDIT) excl Other Income
-0.26
-0.33
21.21%
Interest
0.02
0.00
Exceptional Items
0.00
0.00
Standalone Net Profit
-0.02
0.00
Operating Profit Margin (Excl OI)
-173.33%
-165.00%
-8.33%
Values in Rs Cr.
Direction Arrows
Net Sales

Growth in half year ended Sep 2025 is -25.00% vs 0.00% in Sep 2024

Direction Arrows
Standalone Net Profit

Growth in half year ended Sep 2025 is 0.00% vs -100.00% in Sep 2024

Nine Monthly Results Snapshot (Standalone) - Dec'25stock-summary

Dec'25
Dec'24
Change(%)
Net Sales
1.15
0.20
475.00%
Operating Profit (PBDIT) excl Other Income
0.34
-0.46
173.91%
Interest
0.03
0.00
Exceptional Items
0.00
0.00
Standalone Net Profit
0.53
-0.01
5,400.00%
Operating Profit Margin (Excl OI)
29.57%
-230.00%
259.57%
Values in Rs Cr.
Direction Arrows
Net Sales

YoY Growth in nine months ended Dec 2025 is 475.00% vs -66.10% in Dec 2024

Direction Arrows
Standalone Net Profit

YoY Growth in nine months ended Dec 2025 is 5,400.00% vs -107.69% in Dec 2024

Annual Results Snapshot (Standalone) - Mar'26stock-summary

Mar'26
Mar'25
Change(%)
Net Sales
6.52
0.20
3,160.00%
Operating Profit (PBDIT) excl Other Income
0.58
-0.62
193.55%
Interest
0.03
0.01
200.00%
Exceptional Items
0.00
0.00
Standalone Net Profit
0.78
-0.06
1,400.00%
Operating Profit Margin (Excl OI)
8.90%
-310.00%
318.90%
Values in Rs Cr.
Direction Arrows
Net Sales

YoY Growth in year ended Mar 2026 is 3,160.00% vs -93.42% in Mar 2025

Direction Arrows
Standalone Net Profit

YoY Growth in year ended Mar 2026 is 1,400.00% vs -104.26% in Mar 2025

stock-summaryCompany CV
About Futuristic Solutions Ltd stock-summary
stock-summary
Futuristic Solutions Ltd
Micro Cap
Non Banking Financial Company (NBFC)
Futuristic Solutions Limited was originally incorporated on 21 September, 1983 under the name of Moral Leasing Private Limited. Subsequently the status of the Company got changed from Private Limited Company to Public Limited Company and obtained a fresh Certificate of Incorporation on 23 September, 1983. In 2002, the name of the Company was changed from Moral Leasing Limited to Futuristic Solutions Limited.
Company Coordinates stock-summary
Company Details
M-50 Second Floor M-Block, Market Greater Kailash Part-1 New Delhi New Delhi : 110048
stock-summary
Tel: 91-11-41630436/41634701
stock-summary
futuristicsolutions@gmail.com
Registrar Details
Beetal Financial & Computer Services (P) Ltd , Beetal House , 99 Mandangir, 3rd Floor, Behind Local Shopping Centre, Near Dada Harsukhdas Mandir, New Delhi