
Compare G K Consultants with Similar Stocks
Dashboard
With a Operating Losses, the company has a Weak Long Term Fundamental Strength
- Poor long term growth as Net Sales has grown by an annual rate of -22.33%
Flat results in Mar 26
With ROE of 0.7, it has a Expensive valuation with a 0.8 Price to Book Value
Below par performance in long term as well as near term
Stock DNA
Non Banking Financial Company (NBFC)
INR 13 Cr (Micro Cap)
121.00
21
0.00%
0.00
0.68%
0.82
Total Returns (Price + Dividend) 
G K Consultants for the last several years.
Risk Adjusted Returns v/s
Returns Beta

News

G K Consultants Ltd Valuation Shifts Amidst Market Volatility
G K Consultants Ltd, a micro-cap player in the Non Banking Financial Company (NBFC) sector, has experienced a notable shift in its valuation parameters, moving from a very expensive to an expensive rating. Despite a sharp decline in share price and a downgrade in its Mojo Grade from Strong Sell to Sell, the company’s valuation metrics reveal a complex picture of price attractiveness relative to peers and historical benchmarks.
Read full news article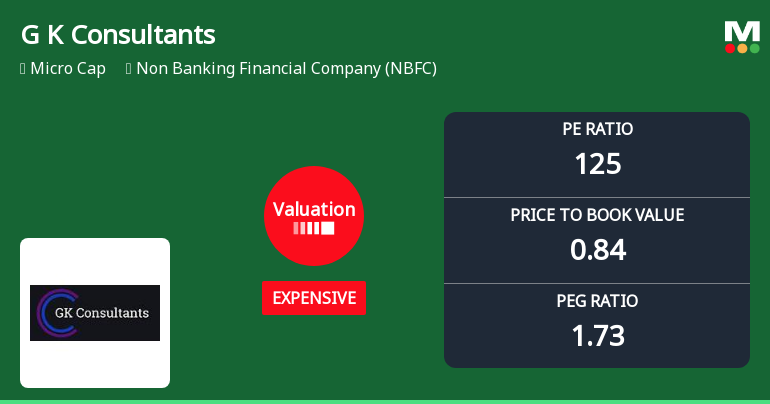
G K Consultants Ltd Valuation Shifts Signal Price Attractiveness Change Amid Market Volatility
G K Consultants Ltd, a micro-cap player in the Non Banking Financial Company (NBFC) sector, has witnessed a notable shift in its valuation parameters, moving from a very expensive to an expensive rating. Despite a recent downgrade in its Mojo Grade from Strong Sell to Sell, the stock’s price-to-earnings (P/E) ratio remains elevated at 124.5, signalling continued market scepticism amid subdued profitability metrics and sector headwinds.
Read full news article
G K Consultants Ltd Rating Upgraded to Sell Amid Mixed Technical and Financial Signals
G K Consultants Ltd, a micro-cap player in the Non Banking Financial Company (NBFC) sector, has seen its investment rating upgraded from Strong Sell to Sell as of 2 July 2026. This change is primarily driven by a shift in technical indicators, despite ongoing challenges in financial performance and valuation metrics. The company’s Mojo Score now stands at 37.0, reflecting a cautious but slightly improved outlook.
Read full news article Announcements
Compliances-Certificate under Reg. 74 (5) of SEBI (DP) Regulations 2018
13-Jul-2026 | Source : BSECertificate under Regulation 74(5) of SEBI (Depositories and Participants) Regulations 2018 for the quarter ended on June 30 2026
Closure of Trading Window
25-Jun-2026 | Source : BSEIntimation regarding Closure of Trading Window
Announcement under Regulation 30 (LODR)-Change in Management
25-Jun-2026 | Source : BSEIntimation under Regulation 30 of SEBI (LODR) Regulations 2015 - Appointment of an Additional Director in the capacity of Non-Executive Independent Director
Corporate Actions

No Upcoming Board Meetings

No Dividend history available

No Splits history available

No Bonus history available

No Rights history available
Quality key factors
Valuation key factors
Technicals key factors
 Technical Indicator Scale: Bearish, Mildly Bearish, Sideways, Mildly Bullish, Bullish Turned
 Shareholding Snapshot : Mar 2026
Shareholding Compare (%holding)
Non Institution
None
Held by 0 Schemes
Held by 0 FIIs
Divya Malini Gupta (0.48%)
Ansh Gupta (10.46%)
91.7%
Quarterly Results Snapshot (Standalone) - Mar'26 - YoY

YoY Growth in quarter ended Mar 2026 is 23.81% vs -8.70% in Mar 2025

YoY Growth in quarter ended Mar 2026 is -1,450.00% vs 300.00% in Mar 2025
Half Yearly Results Snapshot (Standalone) - Sep'25
Growth in half year ended Sep 2025 is 104.17% vs -55.56% in Sep 2024
Growth in half year ended Sep 2025 is 555.56% vs -181.82% in Sep 2024
Nine Monthly Results Snapshot (Standalone) - Dec'25
YoY Growth in nine months ended Dec 2025 is 100.00% vs -42.65% in Dec 2024
YoY Growth in nine months ended Dec 2025 is 6,600.00% vs -107.14% in Dec 2024
Annual Results Snapshot (Standalone) - Mar'26
YoY Growth in year ended Mar 2026 is 71.67% vs -34.07% in Mar 2025
YoY Growth in year ended Mar 2026 is 233.33% vs -78.57% in Mar 2025
About G K Consultants Ltd

Company Coordinates


