
Compare G K Consultants with Similar Stocks
Dashboard
With a Operating Losses, the company has a Weak Long Term Fundamental Strength
- Poor long term growth as Net Sales has grown by an annual rate of -22.33%
Flat results in Mar 26
With ROE of 0.7, it has a Very Expensive valuation with a 1 Price to Book Value
Underperformed the market in the last 1 year
Stock DNA
Non Banking Financial Company (NBFC)
INR 18 Cr (Micro Cap)
150.00
20
0.00%
0.00
0.68%
1.01
Total Returns (Price + Dividend) 
G K Consultants for the last several years.
Risk Adjusted Returns v/s
Returns Beta

News

G K Consultants Ltd Downgraded to Strong Sell Amid Valuation and Financial Concerns
G K Consultants Ltd, a micro-cap player in the Non Banking Financial Company (NBFC) sector, has seen its investment rating downgraded from Sell to Strong Sell as of 1 June 2026. This shift reflects a deteriorating valuation profile, stagnant financial trends, weak quality metrics, and unfavourable technical signals, signalling caution for investors amid challenging market conditions.
Read full news article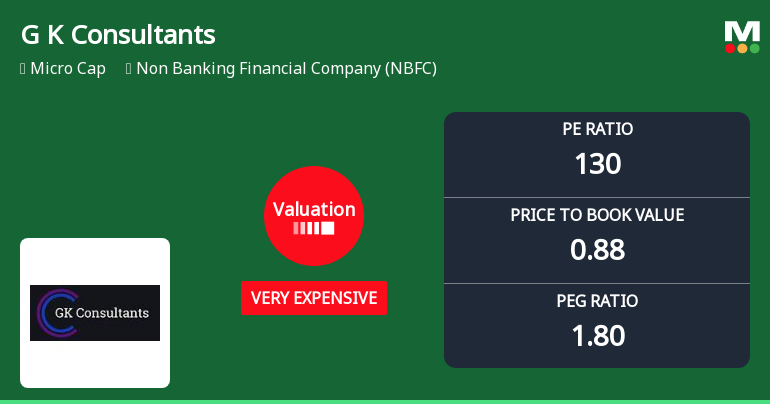
G K Consultants Ltd Valuation Shifts to Very Expensive Amid Mixed Returns
G K Consultants Ltd, a micro-cap player in the Non Banking Financial Company (NBFC) sector, has seen a significant shift in its valuation parameters, moving from very attractive to very expensive territory. Despite a mixed performance track record and modest profitability metrics, the stock’s price-to-earnings (P/E) ratio has surged to 130.09, raising questions about its price attractiveness relative to peers and historical averages.
Read full news article
G K Consultants Q4 FY26: Quarterly Loss Raises Serious Concerns Despite Revenue Growth
G K Consultants Ltd., a micro-cap non-banking financial company, reported a concerning quarterly loss of ₹0.54 crores in Q4 FY26 (Mar'26), marking a sharp reversal from the ₹0.24 crores profit posted in the previous quarter. The loss represents a sequential decline of 325.00% quarter-on-quarter and a deterioration of 1,450.00% year-on-year compared to the ₹0.04 crores profit in Mar'25. The company's stock, currently trading at ₹13.17 with a market capitalisation of ₹15.00 crores, has declined 2.37% in recent trading sessions as investors digest the troubling results.
Read full news article Announcements
Announcement under Regulation 30 (LODR)-Newspaper Publication
30-May-2026 | Source : BSECompliances under Regulation 47 of SEBI (LODR) Regulations 2015
Announcement under Regulation 30 (LODR)-Resignation of Director
30-May-2026 | Source : BSEIntimation of Regulation 30 of SEBI (LODR) Regulations 2015- Resignation of Independent Durector
Announcement under Regulation 30 (LODR)-Resignation of Statutory Auditors
29-May-2026 | Source : BSEIntimation Under Regulation 30 of SEBI (LODR) Regulations 2015- resignation of Statutory Ayditor
Corporate Actions

No Upcoming Board Meetings

No Dividend history available

No Splits history available

No Bonus history available

No Rights history available
Quality key factors
Valuation key factors
Technicals key factors
 Technical Indicator Scale: Bearish, Mildly Bearish, Sideways, Mildly Bullish, Bullish Turned
 Shareholding Snapshot : Mar 2026
Shareholding Compare (%holding)
Non Institution
None
Held by 0 Schemes
Held by 0 FIIs
Divya Malini Gupta (0.48%)
Ansh Gupta (10.46%)
91.7%
Quarterly Results Snapshot (Standalone) - Mar'26 - YoY

YoY Growth in quarter ended Mar 2026 is 23.81% vs -8.70% in Mar 2025

YoY Growth in quarter ended Mar 2026 is -1,450.00% vs 300.00% in Mar 2025
Half Yearly Results Snapshot (Standalone) - Sep'25
Growth in half year ended Sep 2025 is 104.17% vs -55.56% in Sep 2024
Growth in half year ended Sep 2025 is 555.56% vs -181.82% in Sep 2024
Nine Monthly Results Snapshot (Standalone) - Dec'25
YoY Growth in nine months ended Dec 2025 is 100.00% vs -42.65% in Dec 2024
YoY Growth in nine months ended Dec 2025 is 6,600.00% vs -107.14% in Dec 2024
Annual Results Snapshot (Standalone) - Mar'26
YoY Growth in year ended Mar 2026 is 71.67% vs -34.07% in Mar 2025
YoY Growth in year ended Mar 2026 is 233.33% vs -78.57% in Mar 2025
About G K Consultants Ltd

Company Coordinates


