
Compare G R Infraproject with Similar Stocks
Stock DNA
Construction
INR 8,210 Cr (Small Cap)
9.00
44
0.29%
0.36
9.28%
0.89
Total Returns (Price + Dividend) 
Latest dividend: 2.5 per share ex-dividend date: Feb-18-2026
Risk Adjusted Returns v/s
Returns Beta

News

G R Infraprojects Ltd is Rated Sell
G R Infraprojects Ltd is rated Sell by MarketsMOJO, with this rating last updated on 16 Oct 2025. However, all fundamentals, returns, and financial metrics discussed here reflect the company’s current position as of 02 June 2026, providing investors with an up-to-date analysis of the stock’s performance and outlook.
Read full news article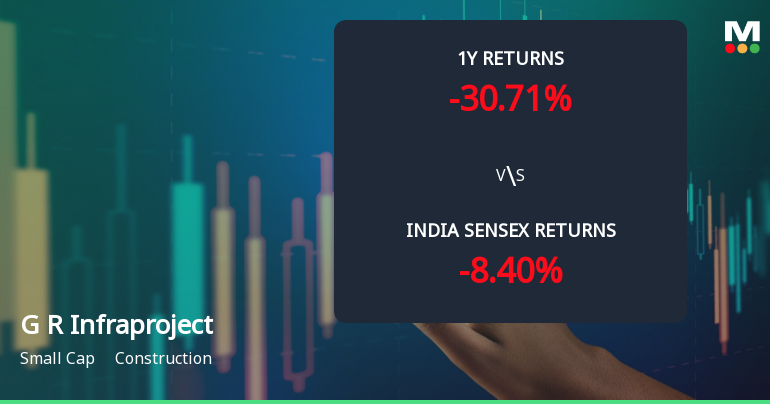
G R Infraprojects Ltd Faces Bearish Momentum Amid Technical Downgrade
G R Infraprojects Ltd, a small-cap player in the construction sector, has experienced a notable shift in its technical momentum, prompting a downgrade in its Mojo Grade from Hold to Sell as of 16 Oct 2025. The stock’s price action and technical indicators reveal a bearish tilt, reflecting investor caution amid broader market pressures and sectoral challenges.
Read full news article
G R Infraprojects Ltd is Rated Sell by MarketsMOJO
G R Infraprojects Ltd is rated Sell by MarketsMOJO, with this rating last updated on 16 Oct 2025. However, the analysis and financial metrics discussed here reflect the stock’s current position as of 22 May 2026, providing investors with an up-to-date view of the company’s fundamentals, returns, and technical outlook.
Read full news article Announcements
Disclosures under Reg. 29(2) of SEBI (SAST) Regulations 2011
02-Jun-2026 | Source : BSEThe Exchange has received the disclosure under Regulation 29(2) of SEBI (Substantial Acquisition of Shares & Takeovers) Regulations 2011 for Ajendra Agarwal & PACs
Disclosures under Reg. 29(2) of SEBI (SAST) Regulations 2011
27-May-2026 | Source : BSEThe Exchange has received the disclosure under Regulation 29(2) of SEBI (Substantial Acquisition of Shares & Takeovers) Regulations 2011 for Harish Kumar Agarwal & PACs
Disclosures under Reg. 10(5) in respect of acquisition under Reg. 10(1)(a) of SEBI (SAST) Regulations 2011
22-May-2026 | Source : BSEThe Exchange has received the disclosure under Regulation 10(5) in respect of acquisition under Regulation 10(1)(a) of SEBI (Substantial Acquisition of Shares & Takeovers) Regulations 2011 for Ajendra Agarwal & Others
Corporate Actions

No Upcoming Board Meetings

G R Infraprojects Ltd has declared 50% dividend, ex-date: 18 Feb 26

No Splits history available

No Bonus history available

No Rights history available
Quality key factors
Valuation key factors
Technicals key factors
 Technical Indicator Scale: Bearish, Mildly Bearish, Sideways, Mildly Bullish, Bullish Turned
 Shareholding Snapshot : Mar 2026
Shareholding Compare (%holding)
Promoters
None
Held by 10 Schemes (19.53%)
Held by 88 FIIs (2.32%)
Lokesh Builders Private Limited (31.8%)
Sbi Mutual Fund (7.47%)
1.88%
Quarterly Results Snapshot (Consolidated) - Mar'26 - QoQ

QoQ Growth in quarter ended Mar 2026 is 8.32% vs 44.07% in Dec 2025
QoQ Growth in quarter ended Mar 2026 is -20.15% vs 34.57% in Dec 2025
Half Yearly Results Snapshot (Consolidated) - Sep'25

Growth in half year ended Sep 2025 is 4.83% vs -21.47% in Sep 2024
Growth in half year ended Sep 2025 is 25.22% vs -33.83% in Sep 2024
Nine Monthly Results Snapshot (Consolidated) - Dec'25
YoY Growth in nine months ended Dec 2025 is 15.22% vs -21.18% in Dec 2024
YoY Growth in nine months ended Dec 2025 is 13.99% vs -20.69% in Dec 2024
Annual Results Snapshot (Consolidated) - Mar'26
YoY Growth in year ended Mar 2026 is 13.58% vs -17.66% in Mar 2025
YoY Growth in year ended Mar 2026 is -10.99% vs -23.37% in Mar 2025
About G R Infraprojects Ltd

Company Coordinates


