
Compare G-Tec Janix with Similar Stocks
Dashboard
With a Operating Losses, the company has a Weak Long Term Fundamental Strength
- Poor long term growth as Operating profit has grown by an annual rate 11.72% of over the last 5 years
- Low ability to service debt as the company has a high Debt to EBITDA ratio of -1.05 times
Flat results in Mar 26
Risky - Negative EBITDA
Below par performance in long term as well as near term
Stock DNA
Other Consumer Services
INR 34 Cr (Micro Cap)
NA (Loss Making)
18
0.00%
0.88
-87.00%
35.27
Total Returns (Price + Dividend) 
G-Tec Janix for the last several years.
Risk Adjusted Returns v/s
Returns Beta

News
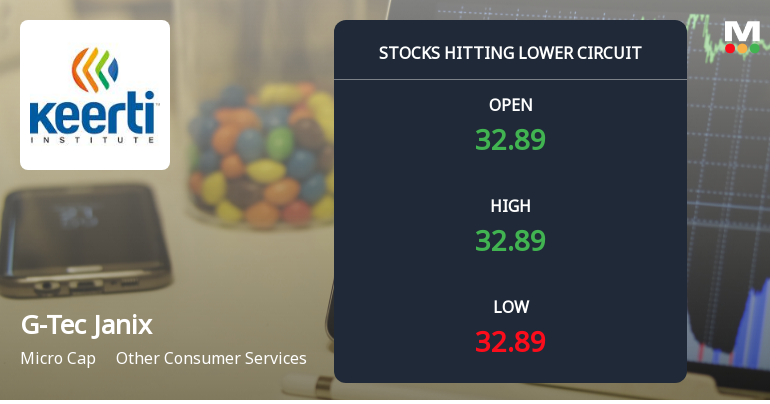
G-Tec Janix Education Ltd Locks at Lower Circuit With 5.0% Loss — Sellers Queue, No Buyers in Sight
At Rs 32.89, sellers were still queuing — but there were no buyers willing to take the other side. G-Tec Janix Education Ltd locked at its lower circuit of 5.0% on 11 Jun 2026, with unfilled sell orders and a frozen price.
Read full news article
G-Tec Janix Education Ltd Locks at Lower Circuit With 4.99% Loss — Sellers Queue, No Buyers in Sight
At Rs 34.62, G-Tec Janix Education Ltd locked at its lower circuit limit of 4.99% on 10 Jun 2026, with persistent selling pressure and no buyers willing to absorb the supply. This freeze at the floor price reflects unfilled sell orders and a market unable to find a clearing level for the stock.
Read full news article
G-Tec Janix Education Ltd Locks at Lower Circuit With 4.98% Loss — Sellers Queue, No Buyers in Sight
At Rs 36.44, sellers were still queuing — but there were no buyers willing to take the other side. G-Tec Janix Education Ltd locked at its lower circuit of 4.98% on 9 Jun 2026, with unfilled sell orders and a frozen price.
Read full news article Announcements
Keerti Knowledge and Skills Limited - Reply to Clarification- Financial results
09-Dec-2019 | Source : NSEKeerti Knowledge and Skills Limited Knowledge and Skills Limited for the quarter ended 30-Sep-2019 with respect to Regulation 33 of the SEBI (Listing Obligations and Disclosure Requirements) Regulations, 2015.
Keerti Knowledge and Skills Limited - Outcome of Board Meeting
05-Dec-2019 | Source : NSEKeerti Knowledge and Skills Limited has informed the Exchange regarding Board meeting held on December 04, 2019.
Keerti Knowledge and Skills Limited - Clarification - Financial Results
03-Dec-2019 | Source : NSEKeerti Knowledge and Skills Limitedge and Skills Limited for the quarter ended 30-Sep-2019 with respect to Regulation 33 of the SEBI (Listing Obligations and Disclosure Requirements) Regulations, 2015.
Corporate Actions

No Upcoming Board Meetings

No Dividend history available

No Splits history available

G-Tec Janix Education Ltd has announced 21:10 bonus issue, ex-date: 01 Jul 20

No Rights history available
Quality key factors
Valuation key factors
Technicals key factors
 Technical Indicator Scale: Bearish, Mildly Bearish, Sideways, Mildly Bullish, Bullish Turned
 Shareholding Snapshot : Mar 2026
Shareholding Compare (%holding)
Promoters
None
Held by 0 Schemes
Held by 0 FIIs
Chajjer Roychand Chenraj (21.14%)
Bharath C Jain (2.74%)
33.49%
Quarterly Results Snapshot (Consolidated) - Mar'26 - YoY

YoY Growth in quarter ended Mar 2026 is -9.25% vs -1.70% in Mar 2025

YoY Growth in quarter ended Mar 2026 is 7.04% vs -51.06% in Mar 2025
Half Yearly Results Snapshot (Consolidated) - Sep'25
Growth in half year ended Sep 2025 is 0.87% vs 1.76% in Sep 2024
Growth in half year ended Sep 2025 is 66.67% vs -45.45% in Sep 2024
Nine Monthly Results Snapshot (Consolidated) - Dec'25
YoY Growth in nine months ended Dec 2025 is 2.84% vs -8.55% in Dec 2024
YoY Growth in nine months ended Dec 2025 is 91.79% vs -865.71% in Dec 2024
Annual Results Snapshot (Consolidated) - Mar'26
YoY Growth in year ended Mar 2026 is 0.00% vs -7.09% in Mar 2025
YoY Growth in year ended Mar 2026 is 73.96% vs -2,716.67% in Mar 2025
About G-Tec Janix Education Ltd

Company Coordinates


