
Compare GACM Tech with Similar Stocks
Stock DNA
Non Banking Financial Company (NBFC)
INR 57 Cr (Micro Cap)
7.00
21
0.00%
0.00
7.98%
0.52
Total Returns (Price + Dividend) 
GACM Tech for the last several years.
Risk Adjusted Returns v/s
Returns Beta

News

GACM Technologies Ltd is Rated Sell
GACM Technologies Ltd is rated 'Sell' by MarketsMOJO, with this rating last updated on 29 July 2025. However, the analysis and financial metrics discussed here reflect the stock's current position as of 17 June 2026, providing investors with an up-to-date perspective on the company’s fundamentals, valuation, financial trends, and technical outlook.
Read full news articleAre GACM Technologies Ltd latest results good or bad?
GACM Technologies Ltd's latest financial results for Q4 FY26 present a mixed picture, highlighting both growth and challenges. The company reported net sales of ₹6.00 crores, reflecting a year-on-year growth of 23.97% from ₹4.84 crores in Q4 FY25, which indicates a positive trend in revenue generation. However, this growth is less robust compared to the previous year's performance, where net sales had surged by 120%. On the profitability front, GACM Technologies recorded a net profit of ₹1.66 crores, which represents a decline of 5.14% year-on-year. This contrasts sharply with the previous year's substantial profit growth of 430.30%. Additionally, the operating margin has contracted to 51.50%, down from 60.99% in the prior quarter, raising concerns about cost management and operational efficiency. The company's return on equity (ROE) stands at 8.70%, which, while showing some improvement, remains below t...
Read full news article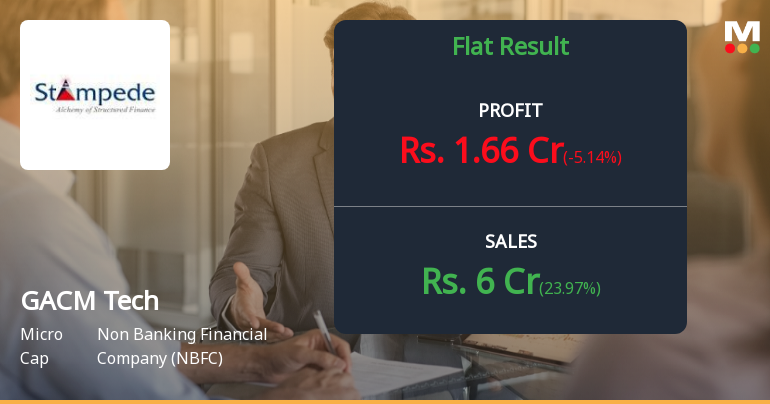
GACM Technologies Q4 FY26: Profit Surge Masks Mounting Structural Concerns
GACM Technologies Ltd., a micro-cap non-banking financial company with a market capitalisation of ₹57.00 crores, reported a net profit of ₹1.66 crores for Q4 FY26, marking a sequential improvement of 40.68% from Q3 FY26's ₹1.18 crores. However, the year-on-year comparison reveals a concerning 5.14% decline from ₹1.75 crores in Q4 FY25, raising questions about the sustainability of recent momentum. Following the results announcement, the stock traded at ₹0.54, down 28.95% over the past year and significantly underperforming the broader market.
Read full news article Announcements
Board Meeting Intimation for Approval For Incorporation Of A Wholly Owned Foreign Subsidiary & Other Business
16-Jun-2026 | Source : BSEGACM Technologies Ltdhas informed BSE that the meeting of the Board of Directors of the Company is scheduled on 25/06/2026 inter alia to consider and approve the incorporation of a Wholly Owned Foreign Subsidiary & Other Business
Receipt Of In-Principle Approval For Issuance Of Foreign Currency Convertible Bonds (Fccbs)
05-Jun-2026 | Source : BSEReceipt of In-Principle Approval for Issuance of Foreign Currency Convertible Bonds (FCCBs)
Announcement under Regulation 30 (LODR)-Newspaper Publication
01-Jun-2026 | Source : BSEINTIMATION REGARDING NEWSPAPER PUBLICATION OF AUDITED STANDALONE AND CONSOLIDATED FINANCIAL RESULTS OF GACM TECHNOLOGIES LIMITED FOR THE QUARTER AND YEAR ENDED MARCH 31 2026
Corporate Actions

25 Jun 2026

No Dividend history available

GACM Technologies Ltd has announced 1:10 stock split, ex-date: 07 Jan 16

GACM Technologies Ltd has announced 1:4 bonus issue, ex-date: 10 Jan 17

GACM Technologies Ltd has announced 51:82 rights issue, ex-date: 28 Apr 25
Quality key factors
Valuation key factors
Technicals key factors
 Technical Indicator Scale: Bearish, Mildly Bearish, Sideways, Mildly Bullish, Bullish Turned
 Shareholding Snapshot : Mar 2026
Shareholding Compare (%holding)
Non Institution
None
Held by 1 Schemes (0.01%)
Held by 3 FIIs (0.35%)
Gayi Adi Holdings Private Limited (0.91%)
None
91.03%
Quarterly Results Snapshot (Consolidated) - Mar'26 - YoY

YoY Growth in quarter ended Mar 2026 is 23.97% vs 120.00% in Mar 2025
YoY Growth in quarter ended Mar 2026 is -5.14% vs 430.30% in Mar 2025
Half Yearly Results Snapshot (Consolidated) - Sep'25

Growth in half year ended Sep 2025 is 138.51% vs 31.22% in Sep 2024
Growth in half year ended Sep 2025 is 648.05% vs 50.98% in Sep 2024
Nine Monthly Results Snapshot (Consolidated) - Dec'25
YoY Growth in nine months ended Dec 2025 is 80.05% vs 67.36% in Dec 2024
YoY Growth in nine months ended Dec 2025 is 191.60% vs 193.83% in Dec 2024
Annual Results Snapshot (Consolidated) - Mar'26
YoY Growth in year ended Mar 2026 is 60.10% vs 82.86% in Mar 2025
YoY Growth in year ended Mar 2026 is 108.74% vs 264.60% in Mar 2025
About GACM Technologies Ltd

Company Coordinates


