
 Price Point
Compare Gala Global with Similar Stocks
ScoreDashboard
With a Operating Losses, the company has a Weak Long Term Fundamental Strength
- Low ability to service debt as the company has a high Debt to EBITDA ratio of -13.88 times
- The company has been able to generate a Return on Equity (avg) of 1.54% signifying low profitability per unit of shareholders funds
Negative results in Jun 26
Risky - Negative EBITDA
Consistent Underperformance against the benchmark over the last 3 years
Mojo ParametersStock DNA

Miscellaneous

INR 8 Cr (Micro Cap)

NA (Loss Making)
39

0.00%

1.05

-29.52%

0.25
Total ReturnsTotal Returns (Price + Dividend) 
Gala Global for the last several years.
Risk Adjusted Returns v/s
Returns Beta
 News & Corporate Actions
News
Are Gala Global Products Ltd latest results good or bad?
Gala Global Products Ltd's latest financial results for Q1 FY27 indicate a significant operational breakdown, with net sales reported at zero for the second consecutive quarter, marking a 100% year-on-year decline. The company also recorded a net loss of ₹0.49 crores, which, while an improvement from the previous quarter's loss of ₹4.36 crores, reflects a troubling trend of ongoing financial distress rather than a recovery in business operations. The company's return on equity has deteriorated to negative 29.52%, highlighting severe capital erosion and a lack of profitability. The interest burden remains a concern, with ongoing costs of ₹0.31 crores despite the absence of revenue generation. Furthermore, the stock has experienced a significant decline of 46.77% over the past year, indicating a lack of market confidence and institutional interest, as evidenced by the promoter holding of only 0.15% and no p...
Read full news article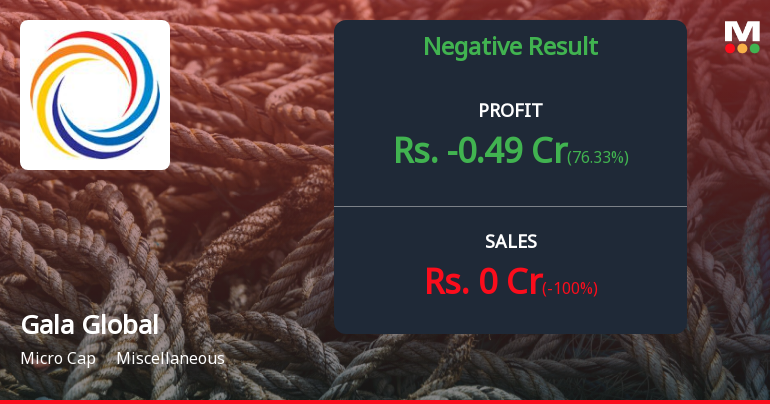
Gala Global Products Q1 FY27: Operational Collapse Deepens as Revenue Vanishes
Gala Global Products Ltd. reported a catastrophic Q1 FY27 performance, with net sales collapsing to zero and net losses widening to ₹0.49 crores, marking a complete operational shutdown in the June 2026 quarter. The micro-cap company, valued at just ₹9.01 crores, continues its downward spiral with the stock plunging 4.62% to ₹1.65 following the dismal results. This represents the second consecutive quarter of zero revenue, signalling fundamental business viability concerns that have eroded shareholder wealth by 46.77% over the past year.
Read full news article Announcements
Closure of Trading Window
22-Sep-2026 | Source : BSEIntimation of closure of trading window for the designated person from Thursday October 1 2026 till 48 hours from declaration of unaudited financial statements for half year ended 30th September 2026.
Intimation Of The Board Of Directors Comments On The Fine Levied By Bombay Stock Exchange
15-Sep-2026 | Source : BSEIntimation of the Board of Directors comment on the fine levied by BSE for delay in submission of statement on shareholder complaints within the period prescribed under Regulation 13(3) of SEBI (LODR).
Intimation Of The Board Of Directors Comments On The Fine
15-Sep-2026 | Source : BSE Corporate Actions

No Upcoming Board Meetings

No Dividend history available

Gala Global Products Ltd has announced 5:10 stock split, ex-date: 10 May 18

Gala Global Products Ltd has announced 1:20 bonus issue, ex-date: 10 May 18

No Rights history available
Key FactorsQuality key factors
Valuation key factors
Technicals key factors
 Technical Indicator Scale: Bearish, Mildly Bearish, Sideways, Mildly Bullish, Bullish Turned Shareholding
Shareholding Snapshot : Jun 2026
Shareholding Compare (%holding)
Non Institution
None
Held by 0 Schemes
Held by 0 FIIs
Vishal Mulchandbhai Gala (0.14%)
Macro Commodeal Private Limited (1.71%)
89.31%
FinancialQuarterly Results Snapshot (Standalone) - Jun'26 - YoY
 Compare with Peers
YoY Growth in quarter ended Jun 2026 is -100.00% vs -99.89% in Jun 2025

YoY Growth in quarter ended Jun 2026 is 76.33% vs -392.86% in Jun 2025

Half Yearly Results Snapshot (Standalone) - Sep'25
Growth in half year ended Sep 2025 is -35.86% vs -64.74% in Sep 2024
Growth in half year ended Sep 2025 is -268.35% vs 239.02% in Sep 2024
Nine Monthly Results Snapshot (Standalone) - Dec'25
YoY Growth in nine months ended Dec 2025 is -17.86% vs -62.21% in Dec 2024
YoY Growth in nine months ended Dec 2025 is -289.66% vs 66.67% in Dec 2024
Annual Results Snapshot (Standalone) - Mar'26
YoY Growth in year ended Mar 2026 is -56.08% vs -44.52% in Mar 2025
YoY Growth in year ended Mar 2026 is -58.13% vs -2,238.10% in Mar 2025
 Company CV
About Gala Global Products Ltd










