
Compare Gala Precis. Eng with Similar Stocks
Stock DNA
Industrial Manufacturing
INR 1,345 Cr (Micro Cap)
38.00
37
0.00%
-0.04
12.41%
4.70
Total Returns (Price + Dividend) 
Gala Precis. Eng for the last several years.
Risk Adjusted Returns v/s
Returns Beta

News

Gala Precision Engineering Ltd is Rated Buy
Gala Precision Engineering Ltd is rated Buy by MarketsMOJO, with this rating last updated on 08 June 2026. However, all fundamentals, returns, and financial metrics discussed here reflect the company’s current position as of 20 July 2026, providing investors with the most up-to-date analysis.
Read full news article
Gala Precision Engineering Ltd is Rated Buy
Gala Precision Engineering Ltd is rated Buy by MarketsMOJO, with this rating last updated on 08 June 2026. However, the analysis and financial metrics discussed here reflect the company’s current position as of 09 July 2026, providing investors with the latest insights into its performance and outlook.
Read full news article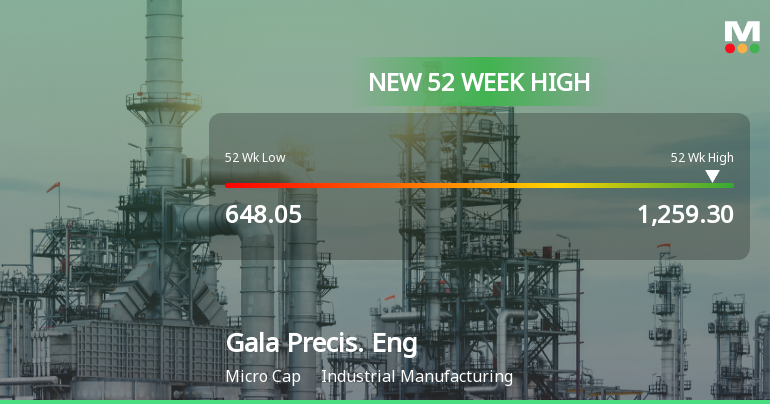
Broad-Based Technical Strength Lifts Gala Precision Engineering Ltd to 52-Week High of Rs 1259.3
Surging to a fresh 52-week high of Rs 1259.3 on 6 Jul 2026, Gala Precision Engineering Ltd has demonstrated remarkable price momentum, outperforming its sector by 4.02% today and extending a five-day winning streak that has delivered 16.04% returns. This rally is underpinned by a confluence of bullish technical indicators and sustained upward price action across multiple timeframes.
Read full news article Announcements
Compliances-Certificate under Reg. 74 (5) of SEBI (DP) Regulations 2018
06-Jul-2026 | Source : BSEPlease find the Compliance Certificate under Regulation 74(5) of SEBI
Shareholder Meeting / Postal Ballot-Scrutinizers Report
03-Jul-2026 | Source : BSEPursuant to Regulation 44(3) of SEBI Enclosing Voting Results for the AGM held on 1st July 2026
Disclosures under Reg. 29(2) of SEBI (SAST) Regulations 2011
02-Jul-2026 | Source : BSEThe Exchange has received the disclosure under Regulation 29(2) of SEBI (Substantial Acquisition of Shares & Takeovers) Regulations 2011 for Alpa Kiran Chheda & Others
Corporate Actions

No Upcoming Board Meetings

No Dividend history available

No Splits history available

No Bonus history available

No Rights history available
Quality key factors
Valuation key factors
Technicals key factors
 Technical Indicator Scale: Bearish, Mildly Bearish, Sideways, Mildly Bullish, Bullish Turned
 Shareholding Snapshot : Jun 2026
Shareholding Compare (%holding)
Promoters
None
Held by 0 Schemes
Held by 5 FIIs (1.3%)
Kirit Vishanji Gala (21.81%)
Pooja Unichem Llp (5.15%)
23.92%
Quarterly Results Snapshot (Consolidated) - Mar'26 - QoQ

QoQ Growth in quarter ended Mar 2026 is 10.92% vs 19.38% in Dec 2025

QoQ Growth in quarter ended Mar 2026 is 47.29% vs -0.95% in Dec 2025
Half Yearly Results Snapshot (Consolidated) - Sep'25
Growth in half year ended Sep 2025 is 28.82% vs 9.11% in Sep 2024
Growth in half year ended Sep 2025 is 29.26% vs 20.31% in Sep 2024
Nine Monthly Results Snapshot (Consolidated) - Dec'25
YoY Growth in nine months ended Dec 2025 is 35.21% vs 11.97% in Dec 2024
YoY Growth in nine months ended Dec 2025 is 38.00% vs 8.65% in Dec 2024
Annual Results Snapshot (Consolidated) - Mar'26
YoY Growth in year ended Mar 2026 is 32.15% vs 17.42% in Mar 2025
YoY Growth in year ended Mar 2026 is 32.14% vs 20.24% in Mar 2025
About Gala Precision Engineering Ltd

Company Coordinates


